3. Strategic objective 3: To mitigate, adapt to, and manage the effects of drought in order to enhance resilience of vulnerable populations and ecosystems
3.1. SO 3-1 – Trends in the proportion of land under drought over the total land area
3.1.1. Introduction
The United Nations Convention to Combat Desertification (UNCCD) defines drought as the naturally occurring phenomenon that exists when precipitation has been significantly below normal recorded levels, causing serious hydrological imbalances that adversely affect land resource production systems[1].
Indicator SO 3-1 specifically describes the status (i.e., the occurrence or absence of drought and its severity, if occurring) of meteorological drought hazards on an annual basis within a country.
There are several drought indices that may be used to estimate national drought hazard. The UNCCD methodology to estimate indicator SO 3-1 recommends using a specific globally accepted drought index known as the Standardized Precipitation Index (SPI), to characterize the meteorological drought hazard. However, Parties may report using other indices if already in use at national level, e.g., the Standardized Precipitation Evapotranspiration Index (SPEI). For other indices currently in use, Parties may need to ensure statistical consistency with the SPI drought intensity classes described in table 19[2].
The overall objective is for Parties to assess drought hazard and identify areas under drought in order to prioritize mitigation efforts in conjunction with assessments of drought exposure (SO 3-2) and vulnerability (SO 3-3). National reporting is facilitated through the provision of default data.
3.1.2. Prerequisites for reporting
An in-depth reading of chapter 1 of the “Good Practice Guidance for National Reporting on UNCCD Strategic Objective 3: To mitigate, adapt to, and manage the effects of drought in order to enhance resilience of vulnerable populations and ecosystems” detailing the methodology used to estimate drought hazards and the changes over time.
Data complying with the specifications listed in figure 5 and table 18.
A pool of national experts officially nominated by the national authorities to verify the consistency of the results of the reporting process with the situation in the field, or to develop and implement a custom methodology to estimate indicator SO 3-1 where national data are preferred to the default data. Key institutions might include a country’s national meteorological and hydrological service (NMHS), ministry of environment, ministry of agriculture, remote sensing centre and national statistical office, as well as relevant universities and research centres.
3.1.3. Reporting process and step-by-step procedure
The step-by-step procedure for reporting is described in the following. If the default data is used, steps 2 to 5 are unnecessary.
Step 1: Select drought index or precipitation dataset
The UNCCD provides default data from the Global Multi-Index Drought (GMID) Product, a gridded set of drought indices that includes the SPI and SPEI calculated using precipitation data derived from combined rain gauge, satellite observations and reanalysis data. See Box 5 below for an overview of this product.
While the SPI remains the recommended index to estimate indicator SO 3-1, Parties should determine if the SPEI is more appropriate to their specific circumstances, particularly in arid and semi-arid areas where rainfall is erratic and cumulative amounts are low. As the SPEI accounts for both precipitation and air temperature, it may provide a more accurate measure of water availability in these areas, where evapotranspiration losses may be significant. A more detailed discussion on when one index may be preferred to the other can be found in section 1.5 of the Good Practice Guidance for National Reporting on UNCCD Strategic Objective 3.
If country Parties already have a national drought index such as SPI or SPEI they may preferentially use that instead of the UNCCD default data. Alternatively, if they wish to calculate the SPI themselves they have the option to use an alternative dataset provided in Trends.Earth or use in-country precipitation data.
The alternative dataset available via Trends.Earth is the Climate Hazards Group InfraRed Precipitation with Stations (CHIRPS), which produces high-resolution rainfall estimates based on satellite observations and gauged station data. While the slightly higher spatial resolution of CHIRPS is advantageous when deriving the SPI, a disadvantage is that it does not have global coverage and only spans 50°S to 50°N. Therefore, Parties with country boundaries outside of this range will not be able to use the CHIRPS dataset. In contrast, the GMID has global coverage. While the GMID consists of both SPI and SPEI, for CHIRPS only the SPI will be available in Trends.Earth.
The decision tree in figure 5 can help Parties to decide which data set and approach is most appropriate to support reporting for their national situation.
Figure 5. Decision tree to help Parties chose the best precipitation or drought index data source to derive indicator SO 3-1
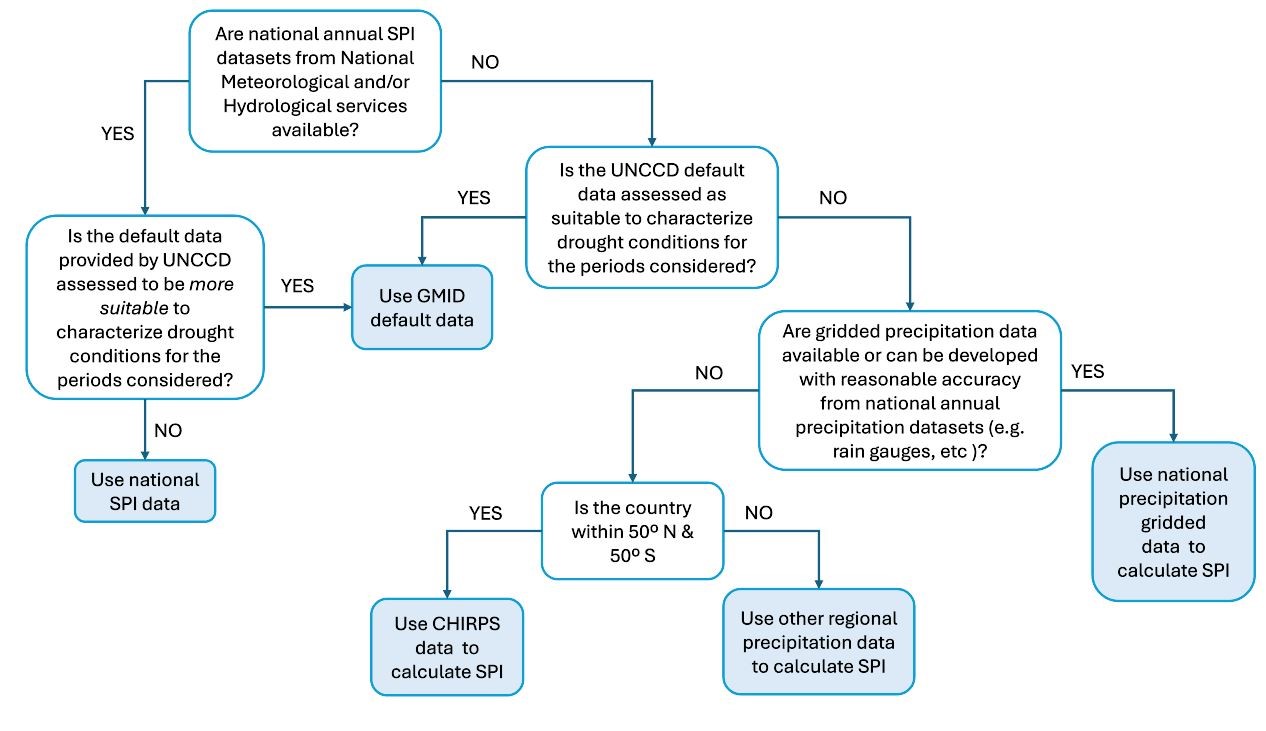
GMID: Global Multi-Index Drought,
SPI: Standardized Precipitation Index,
CHIRPS: Climate Hazards Group InfraRed Precipitation with Stations
This decision-making process should help Parties identify data that meets the specifications summarized in table 18.
Item |
Specifications |
|
|---|---|---|
Default data |
National data |
|
Input data Data needed to generate drought hazard estimates based on the Standardized Precipitation Index (SPI) calculations described in Step 2 |
Global Multi-Index Drought (GMID) monthly drought index products, 1980–2023. |
Gridded products of monthly total precipitation derived from national gauge networks. In order to calculate the WMO-aligned reference period, the dataset should ideally have a continuous record of at least 30 years, covering the period 1981–2010. For countries in the 50°S to 50°N range: Climate Hazards Group InfraRed Precipitation with Stations (CHIRPS) monthly precipitation products, 1981–present, can be accessed in Trends.Earth*. Alternative accumulation periods to SPI-12 are also possible in Trends.Earth when using CHIRPS, e.g. SPI-9, SPI-24 and SPI-48. |
Output data Intermediate and final gridded products resulting from the analysis described in Steps 2 to 4 |
December SPI-12 grids classified into four SPI drought intensity classes on an annual basis*. Total land area for each drought intensity class as well as proportion of total land area under drought. Gridded spatial summary in four-year periods. |
Annual December SPI-12 grids classified into four SPI drought intensity classes on an annual basis*. Total land area for each drought intensity class as well as proportion of total land area under drought. Gridded spatial summary in four-year periods. |
Classification |
Four SPI drought intensity classes as per table 19. |
Four SPI drought intensity classes as per table 19. |
Spatial resolution |
GMID: 0.1° x 0.1° (~11.1 km) |
CHIRPS: 0.05° x 0.05° (~5.55 km) or otherwise assessed by national authorities based on available data |
Quality |
Specified in the datasets’ metadata. |
Data should be continuous where possible; where data completeness is less than 85%, Parties may consider filling data gaps in accordance with guidance from the World Meteorological Organization (WMO, 2018). |
Metadata |
Metadata information is provided with default data. |
Minimum metadata content as per the mandatory fields listed in Annex II. |
* As stated in Step 3, the December SPI-12 values represent the precipitation deficits (or excesses) over the Gregorian (January–December) calendar year.
Box 5. The Global Multi-Index Drought (GMID) dataset
This dataset comprises the Standardized Precipitation Index (SPI) and the Standardized Precipitation Evapotranspiration Index (SPEI) from 1- to 12-month time scales at high spatial resolution, covering the period 1980-2023 on a global scale. The dataset affords spatial coverage across global longitudes from -180° to 180° and latitudes from 90° to -90°. The data are provided in geographic coordinates (latitude/longitude) based on the WGS 84 (World Geodetic System 1984) reference system, at 0.1° resolution.
SPI and SPEI were calculated based on the most widely used and recommended probability distribution for their calculation at different time scales. Thus, SPI was calculated adopting a Gamma distribution, while SPEI was computed adopting a log-logistic distribution. The dataset was generated using different meteorological input datasets, including: precipitation data from the Multi-Source Weighted-Ensemble Precipitation (MSWEP) v2.8 (https://www.gloh2o.org/mswep/), and potential evapotranspiration data derived from the Global Land Evaporation Amsterdam Model (GLEAM) v4.2a (https://www.gleam.eu). The data was downloaded at daily time steps, then aggregated monthly, and finally summarized at different accumulation periods to obtain the indices at 1-, 2-, 3-, 4-, 5-, 6-, 7-, 8-, 9-, 10-, 11- and 12-month times scales.
The full GMID dataset is available at: https://eidc.ac.uk/
Step 2: Calculate the Standardized Precipitation Index
Monthly time series of the SPI are based on the selected gridded precipitation data and calculated using the SPI-12 method, which provides an annual summary of precipitation deficits for each month using a 12-month accumulation method. For example, the 12-month precipitation accumulation for December 2019 is the total monthly precipitation for January 2019 to December 2019.
It is important to ensure that for each reporting year, the precipitation data are standardized against the same ‘reference period’ or climatological standard normal period. This ensures data are comparable between years as well as across both time and space. In order to normalize the 12-month precipitation accumulation data distributions, the WMO climatological standard normal period of 1981–2010 is used as a reference period. The normalization method is based on a Gamma probability distribution function fitted to the 12-month precipitation accumulations in this reference period. Once calculated, these probability distribution parameters are then applied to any time series of monthly 12-month precipitation accumulations to produce the normalized monthly SPI-12 time series for each grid cell for the entire period for which data is available. However, if Parties choose to change the standard climate normal (reference) period this then necessitates a recalculation of the SPI for all periods. As such, it is recommended that the reference period used to calculate the SPI be clearly stated in national reports of indicator SO 3-1 to the UNCCD.
Default SPI and SPEI data is available in Trends.Earth for the purposes of SO3 monitoring. However, there are various open access tools that can be used to derive the SPI, a selection of which is listed in table 3 of the Good Practice Guidance for National Reporting on UNCCD Strategic Objective 3.
Step 3: Identify the drought intensity class of each grid cell based on the calculated Standardized Precipitation Index value
Note
Related areas in the PRAIS 4 platform: table SO3-1.T1
To assess the SPI time series on an annual basis, the December SPI-12 values for each year should be extracted. The December SPI-12 values represent the precipitation deficits (or excesses) over the Gregorian (January–December) calendar year.
For each of the December SPI-12 grids, the number of cells belonging to each of the SPI drought intensity classes listed in table 19 should be counted. Note that any cell with a value> 0 represents a non-drought area.
SPI values |
Drought intensity class |
|---|---|
0 to -0.99 |
Mild drought |
-1.0 to -1.49 |
Moderate drought |
-1.5 to -1.99 |
Severe drought |
-2 and less |
Extreme drought |
The total area under each drought intensity class should be derived in a two-step process:
Project the drought intensity class grid into a suitable equal area projection (e.g., Mollweide) to obtain the cells’ area in km2.
Combine all cells’ area in a given drought class to get the total area under each drought intensity class.
Step 4: Calculate proportion of land under drought without class breakdown
Note
Related areas in the PRAIS 4 platform: table SO3-1.T2
The proportion of land under drought irrespective of intensity class is calculated for each reporting year as a percentage of the total land area.
For each of the annual SPI-12 grids, the total number of cells falling in any of the SPI drought intensity classes is counted (cellCount). Then, for each reporting year, the percentage of the total land area under drought is calculated. The formula is as follows:
\(P_{j} = \frac{cellCount_{j}}{\text{Total number of cells}} \times 100\)
Where:
“Pj” is the proportion of land under drought in the reporting year (j)
“cellCountj” is the total number of pixels under drought in the reporting year (j)
“Total number of cells” is all the grid cells within the country Party’s land area.
The total area falling under drought in each year is calculated by multiplying cellCount by the area of the cells (a constant value, since the drought intensity class grid was previously converted to an equal-area projection).
Step 5: Create drought intensity maps for four-year periods
In addition to the tabular reports described above, indicator SO 3-1 should also be summarized spatially to map the highest intensity drought conditions that occurred over four-year periods. Four-year periods are chosen to reduce the reporting burden and amount of data that would be associated with annual reporting of spatial information.
To summarize these periods spatially, for each grid cell the highest drought intensity class in that cell should be identified within the four-year periods. For example if a grid cell has the values (mild, mild, moderate, mild) for a given four-year period, then the cell should contain the value for “moderate” for that four-year period.
The highest drought intensity for the four-year periods should be mapped using the gridded SPI-12 data in four-year intervals (2000–2003, 2004–2007, 2008–2011, 2012–2015, 2016-2019 and 2020-2023). If country Parties have gaps (i.e., years missing) in their data sets they should summarize over the most appropriate periods to align as closely as possible with the above four-year periods. For example, if part of the data set is represented by 2004, 2007, 2008, 2009, 2011, then the most appropriate summary periods would be (2004, 2007) and (2008, 2009, 2011).
Step 6: Verify the results
Parties should be aware of the limitations related to the use of SPI as a single drought indicator and critically review the default data vis-à-vis the national rain gauge data and other meteorological sources before submitting their national reports.
Step 7: Save form and make available for review
Observed changes and their interpretation may be described in the comments fields associated with the reporting tables of the PRAIS 4 platform.
Default drought intensity maps or maps generated in Trends.Earth using national data representing the highest intensity drought conditions for four-year periods are made available in the PRAIS 4 platform. More specifically, the following maps will be available:
Highest intensity drought conditions in 2000–2003
Highest intensity drought conditions in 2004–2007
Highest intensity drought conditions in 2008–2011
Highest intensity drought conditions in 2012–2015
Highest intensity drought conditions in 2016–2019
Highest intensity drought conditions in 2020–2023
Parties should note that the default four-year drought intensity maps are based on the same default data reported in SO3-1.T1. However, as explained in step 5, should a Party report national data and there are years missing, the summary maps can be produced using the available data that aligns best with the above four-year periods. Parties are also encouraged to submit narratives, by using the “General Comments” field, on the methodology, data sources, data accuracy and data gaps in the event that the estimates are derived from national data. It would also be beneficial to report on special cases and issues, describing situations where SPI values might be less reliable and providing the rationale for adoption of a different methodology.
Once the form has been completed and verified by the Parties, it should be marked as “In Review” and then saved. Once the UNCCD has completed its review and all comments have been resolved, the form can be marked as “Finalized” and then Saved.
3.1.4. Dependencies
Drought hazard data relies on the total land area reported in table CP-1.T1 to calculate the proportion of total land area under drought. SO 3-1 outputs are also used as an input for calculating indicator SO 3-2.
3.1.5. Challenges
Data availability and quality
Internationally available precipitation data might not be sufficiently accurate to estimate the intensity of drought hazard at national level. The use of national data is recommended because it is assumed to be more precise and reliable. However, national precipitation data might not be readily available in digital form and/or might be affected by gaps in the time series.
Limitations of the SPI-based estimates
While the SPI is recommended as a well-established, flexible and robust drought index to quantify drought hazard on a global scale, it only quantifies the meteorological deficits, since it is solely based on precipitation, and other types of drought (e.g., hydrological, agricultural) may not be well captured. Moreover, in regions with very low and/or a high proportion of months with zero precipitation, the SPI values should be used and interpreted with caution; the application of the SPEI might be more appropriate in such regions. Being aware of this limitation, the national expert may highlight areas where estimates based on the SPI may not produce sufficiently accurate results and may base the estimates on alternative indexes. A discussion of SPI limitations can be found in section 1.5 of the “Good Practice Guidance for National Reporting on UNCCD Strategic Objective 3
Hyper arid areas are included in the default SPI data provided. However, the index values over these areas should be considered carefully given the limitations of drought index computation over such areas. These limitations may lead to an over or underestimation of drought events in hyper arid areas.
Because of the natural climate variability, any observed changes or trends in the proportion of land under drought over the reporting time frames should be interpreted with caution. Anomalies and uncertainties in the estimates should be described in the “Comments for the above table” field.
The adopted timescale made available through the GMID default data, based on the 12-month cycle, might not always be suitable for characterizing drought impacts in some environments. If Parties use their own data they should determine if other aggregation periods, e.g., 24 months, might be more appropriate.
3.1.6. Summary (main actions)
Key actions for reporting drought hazard intensity values are as follows:
Select drought index or precipitation dataset: Parties may decide to use the default drought index data or alternative national sources, provided they comply with the data specifications listed in table 18. If Parties decide to use an alternative precipitation data source, they should follow actions 2 to 5 below:
Calculate the SPI: the SPI should be derived for all months in the full available time series; however, Parties may choose alternative indexes (e.g., SPEI) better suited to their local environmental conditions.
Identify the drought intensity class of each grid cell: based on the SPI (or other drought index) calculation, the number of cells belonging to each of the drought intensity classes should be counted and converted to areas by projecting the drought intensity class grids into a suitable equal area projection, and calculating the total area under each drought intensity class in km2. Data is then reported in table SO3-1.T1.
Calculate proportion of land under drought: the proportion of land in each drought intensity class and the overall proportion of land under any drought conditions over the total land area are calculated for each reporting year and reported in tables SO3-1.T1 and SO3-1.T2.
Create a set of drought intensity maps: data for the entire time series from 2000 to 2023 should be summarized spatially using the gridded SPI-12 data, preferably in four-year intervals (2000–2003, 2004–2007, 2008–2011, 2012–2015, 2016–2019 and 2020-2023) to map the highest intensity drought conditions in each period.
Verify the results: aware of the limitations related to the use of the SPI or other drought indexes for estimating drought intensity, Parties should verify the suitability of such an index to describe drought occurrence and intensity in their countries before officially submitting estimates for UNCCD reporting.
Save form and make available for review: Once verified by the Parties, the data and supporting narrative should be marked as “In Review” and saved thereby making it available for review by the UNCCD.
3.1.7. Additional Resources
WMO, 2018, Guide to climatological practices, second edition. Geneva, Switzerland. (https://library.wmo.int/viewer/60113)
3.2. SO 3-2 – Trends in the proportion of the population exposed to drought
3.2.1. Introduction
Indicator SO 3-2 defines the exposure of the population to drought hazard (identified by indicator SO 3-1) as the total count of people exposed as well as the percentage of the total population exposed. This indicator may be further disaggregated by sex if data is available.
The method of computation uses the spatial distribution of the population or sub-population group (i.e., by sex) to establish its exposure to drought, based on the location and extent of the drought intensity classes as determined by indicator SO 3-1. Using this information, the percentage of the total population located within each drought intensity class, as well as the percentage of the total population exposed to drought (i.e., to all drought intensity classes), is calculated and reported. National reporting is facilitated though the provision of default data.
3.2.2. Prerequisites for reporting
An in-depth reading of chapter 2 of the “Good Practice Guidance for National Reporting on UNCCD Strategic Objective 3: To mitigate, adapt to, and manage the effects of drought in order to enhance resilience of vulnerable populations and ecosystems” detailing the methodology used to estimate drought exposure.
Data complying with the specifications listed in figure 6 and table 20.
A pool of national experts officially nominated by the national authorities to verify the consistency of the results of the reporting process against the situation in the field, or to develop and implement a custom methodology to estimate indicator SO 3-2 where national data is preferred to default data. The key institution in this case is a country’s national statistical office, however universities and research centres may also provide valuable inputs.
3.2.3. Reporting process and step-by-step procedure
The step-by-step procedure for reporting is described in the following. If the default data is used, Steps 2 to 4 are unnecessary.
Step 1: Select the population dataset
There are various publicly available, fine-spatial resolution population datasets available at the global scale and one of these, WorldPop, is provided to country Parties by default to derive indicator SO3-2. National estimates of female, male and total population for the period 2000 to 2023 are automatically pre-filled in table CP-1.T2 and are also available as annual gridded maps of population. However, Parties should note that the 2000-2020 WorldPop dataset used as a source of default data for 2026 reporting has not been updated and therefore the final three years (2021, 2022, and 2023) duplicate values for 2020. These data can be used in the absence of national demographic data for the calculation of the indicator SO3-2.
However, Parties may choose to use alternative global or national datasets of annual sex-disaggregated population counts. In this case, these values should be input to CP1.T2. The underlying data should be a gridded population product covering the full extent of the country. If the available dataset is a vector product (e.g. representing administrative areas) it should first be converted to a regular grid representing the number of people living in each location (grid cell). Ideally the data should be annual population counts, for the total as well as the sex disaggregated (male, female) groups.
Parties wishing to use in-country or regional population datasets can use the decision tree in figure 6 to assess whether this data is more appropriate to derive indicator SO 3-2 over the globally available datasets.
Figure 6. Decision tree to help Parties choose the best population data source to derive indicator SO 3-2
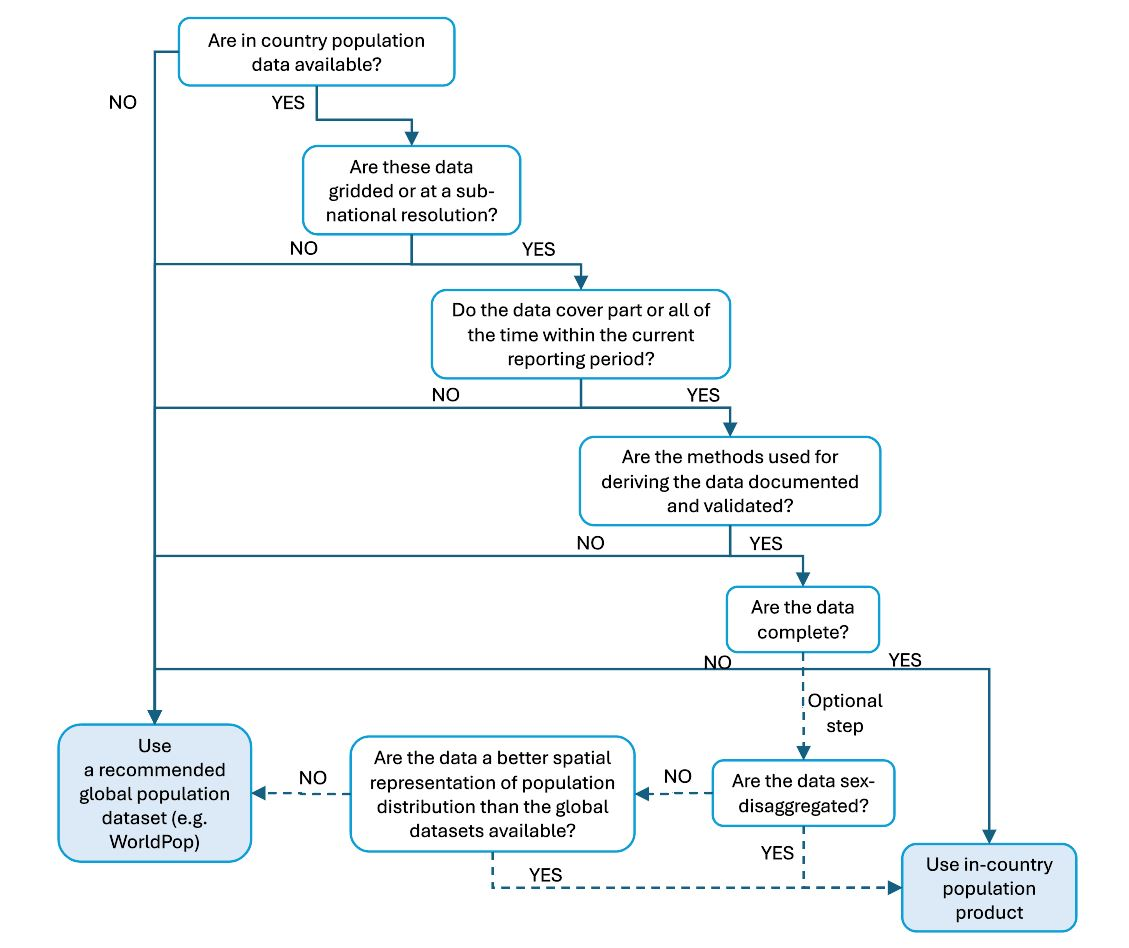
This decision-making process should help Parties identify data that meets the specifications summarized in table 20.
Item |
Specifications |
|
|---|---|---|
Default data |
National data |
|
Input data Data needed to generate indicator SO 3-2, as described in Steps 2 to 4 |
WorldPop data for each year in the period 2020–2023, disaggregated by sex (with the 2020 data duplicated for 2021,2022 and 2023 due to the lack of updated WorldPop population data post-2020). Drought intensity class data as determined by indicator SO 3-1. |
Gridded population products derived from national official statistics from the year 2000 to the reporting year, ideally annual and, if available, disaggregated by sex. Drought intensity class data as determined by indicator SO 3-1. |
Output data Gridded products resulting from the analysis described in Steps 2 to 4 |
Annual gridded products of (i) total, (ii) female and (iii) male population exposed to the four drought intensity classes from the year 2015 to the reporting year. Percentage of total, female and male population exposed to drought and to each drought intensity class. Gridded spatial summary in four-year periods. |
Annual gridded product of (i) total, (ii) female and (iii) male population exposed to the four drought intensity classes from the year 2000 to the reporting year. Percentage of total, female and male population exposed to drought and to each drought intensity class. Gridded spatial summary in four-year periods. |
Spatial resolution |
WorldPop data: 3-arc seconds (~0.00083º or ~100 m) Drought Hazard Intensity data: 0.1° x 0.1° (~11.1 km) |
Assessed by national authorities based on available data. |
Metadata |
Metadata information is provided with default data. |
Minimum metadata content as per the mandatory fields listed in Annex II. |
Step 2: Overlay gridded population data with indicator SO 3-1 spatial output
Indicator SO 3-2 is calculated by overlaying the population data on the drought hazard intensity (SO3-1) spatial data for each year. If non-default data is used gap years should be filled with the closest available population data. For example, if the 2019 data is missing, it should be replaced by the 2020 data (or the closest available year), then 2020 data would be used for both 2019 and 2020. In addition to the total population, sex-disaggregated population data grids, if available, should be used in the overlay process to generate sex-disaggregated drought exposure values.
Population and drought hazard intensity data should have the same coordinate reference system and geographical projection, which should be consistent across the annual reporting periods. Moreover, both data sets need to have the same grid size. To do this the 0.1° x 0.1° (~11.1 km) GMID data should be resampled to a 0.00083º ( ~100 m) grid (same as WorldPop) using the Nearest Neighbour resampling technique.
Step 3: Calculate the proportion of the population exposed within each drought intensity class
Note
Related areas in the PRAIS 4 platform: tables SO3-2.T1, SO3-2.T2 and SO3-2.T3
Using the outputs of Step 2, the number of people falling within each of the four drought intensity classes, as well as the total number of people exposed to drought (i.e., to all drought intensity classes), can be estimated for each year. The respective percentages are then calculated out of the total population as reported in CP-1.T2. These annual percentage values are then reported in table SO3-2.T1. The total exposed population count as a number is autocalculated by PRAIS using the total population value reported in CP-1.T2. This is then automatically reported in table SO3-2.T1.
Similarly, if sex disaggregated data is used, for each year available the number of males and number of females within each drought intensity class, as well as the total number of males and females exposed to drought, can also be calculated. These should then be expressed as percentages with respect to the total national population of that sex. The percentage values for the female population are reported in table SO3-2.T2. The percentage values for males are reported in table SO3-2.T3.
Parties are encouraged to submit narratives in the Comments field associated with tables SO3-2.T1, SO3-2.T2 and SO3-2.T3 on the methodology, data sources and data accuracy in the event that the estimates are derived from non-default alternative global or national data.
Step 4: Create drought exposure maps in four-year periods
In addition to the annual values of indicator SO 3-2 entered in the tables in step 3, drought exposure maps in four-year periods for the entire period are also to be produced externally and uploaded to PRAIS. These exposure maps give an indication of the number of people exposed to the highest intensity drought class over each four-year period for each grid cell. Four-year periods have been chosen to reduce the reporting burden and the quantity of data to be uploaded in PRAIS. See step 5 for indicator SO 3-1 for more detail on preparing the drought maps.
Step 5: Verify the results
Parties should be aware of the limitations of using SPI as a drought indicator (see SO3-1 above) and critically review the results before submitting the reports to the UNCCD.
Step 6: Save form and make available for review
Observed changes and their interpretation may be described in the comments fields associated with each table in the PRAIS 4 platform.
Default maps are made available in the PRAIS 4 platform as follows:
Total population exposed to drought in 2000–2003
Total population exposed to drought in 2004–2007
Total population exposed to drought in 2008–2011
Total population exposed to drought in 2012–2015
Total population exposed to drought in 2016–2019
Total population exposed to drought in 2020–2023
These maps show the highest drought intensity class a population was exposed to within each 4-year period, as explained in Step 4.
Parties that generate maps in Trends.Earth using national or alternative data representing population exposed to drought can upload the same maps listed above to PRAIS 4 should they have sufficient data availability.
Parties are also encouraged to submit narratives on the methodology, data sources and data accuracy in the event that the estimates are derived from national data using the “General Comments” field. It would also be beneficial to report on special cases and issues, describing situations where values might be less reliable and providing the rationale for the adoption of a different methodology.
Once the form has been completed and verified by the Parties, it should be marked as “In Review” and then saved. Once the UNCCD has completed its review and all comments have been resolved, the form can be marked as “Finalized” and then Saved.
3.2.4. Dependencies
Drought exposure data relies on the SO 3-1 spatial outputs and the population estimates from table CP-1.T2.
3.2.5. Challenges
Data availability and quality
Among the publicly available global population datasets, the WorldPop dataset is used by default by the UNCCD for calculating indicator SO2-3 and provided to Parties in Trends.Earth. It should be noted that while the School of Geography and Environmental Science at the University of Southampton (UK) has recently released a new global demographic dataset for 2015–2030, it was published after the launch of the 2026 reporting process, therefore it could not be integrated into the default datasets provided to Parties. Nonetheless, Parties can download the new sex-disaggregated datasets directly from here: https://hub.worldpop.org/project/categories?id=8. A third-party GEE app allows comprehensive exploration of the dataset. If these datasets are deemed appropriate, Parties can upload them to Trends.Earth, calculate the respective indicator data and import the results to PRAIS 4 to replace the default data.
Parties should also note that the 2000-2020 WorldPop dataset used as a source of default data for 2026 reporting has not been updated and therefore the final three years (2021, 2022, and 2023) duplicate values for 2020.
Global data quality and spatial resolution might not be sufficiently accurate for national population estimates. The integration of global and national data might improve the quality and accuracy of the results but will require that Parties have additional processing capacity and technical skills.
The methodology only considers population density and distribution and does not cover ecosystem exposure to drought. A more comprehensive measure of drought exposure may take into account other physical entities at risk, such as agricultural yields, livestock counts, sectoral water and certain types of vegetation. In addition, being exposed to drought does not equate to drought vulnerability.
3.2.6. Summary (main actions)
Key actions for reporting population exposure to drought hazard are as follows:
Select the population dataset: Parties may decide to use the default data or alternative global or national sources, provided they comply with the data specifications listed in table 20. If Parties decide to use alternative data sources, they should follow actions 2 to 4 below.
Overlay population data on indicator SO 3-1 spatial output: indicator SO 3-2 is calculated by overlaying the yearly population data on yearly hazard intensity data derived from the SO 3-1 analysis.
Calculate the total exposed proportion of the population as well as the proportion of the population within each drought intensity class: the entire population exposed to drought, in terms of population count is auto-calculated in PRAIS 4 based on the demographics reported in CP-1.T2. The proportion of males and females within each drought intensity class should also be reported.
Create drought exposure maps in four-year periods: the gridded spatial summary for each four-year period provides information on the number of people exposed to the highest drought intensity class over each four-year period, from 2000 (or earliest year for which population data is available) to the reporting year, at the scale of the grid cell. These four-year periods should be consistent with the gridded spatial summaries reported at SO 3-1.
Verify the results: aware of the limitations of the estimated values of drought exposure, Parties may verify the accuracy and reliability of such an indicator in their countries before officially submitting estimates for UNCCD reporting.
Save form and make available for review: once verified by the Parties, the data and supporting narrative should be marked as “In Review” and saved thereby making it available for review by the UNCCD.
3.2.7. Additional Resources
Beta Test Our New Global Population Data – 2015 to 2030, WorldPop (https://www.worldpop.org/blog/beta-test-our-new-global-population-data-2015-to-2030/)
3.3. SO 3-3 – Trends in the degree of drought vulnerability
3.3.1. Introduction
The UNCCD approach to assessing drought vulnerability is based on a composite index, the Drought Vulnerability Index (DVI), which incorporates three components to reflect the vulnerability of the population of an individual country to drought: i) social, ii) economic and iii) infrastructural. The DVI does not, at present, address ecological or ecosystem vulnerability.
The DVI may be derived through three alternative processes, corresponding to three increasing levels of computational complexity:
Tier 1 Vulnerability Assessment (VA) – uses at least one factor per vulnerability component, represented by country-level metrics.
Tier 2 VA – uses more than one factor per vulnerability component, where the factors are represented by country-level metrics, with the inclusion of sex-disaggregated data (where applicable).
Tier 3 VA – uses more than one factor per vulnerability component, where factors are represented by sub-national metrics (which may be gridded or disaggregated by administrative regions), with the inclusion of sex-disaggregated data (where applicable).
Parties may opt for the approach best suited to their current capacity to collect and process data, subject to data availability.
The UNCCD provides Parties with default data derived from the global DVI dataset of the European Commission Joint Research Centre (JRC) to facilitate the reporting process. This data is based on globally available datasets and should be used in the absence of more accurate data at national level.
3.3.2. Prerequisites for reporting
An in-depth reading of chapter 3 of the “Good Practice Guidance for National Reporting on UNCCD Strategic Objective 3: To mitigate, adapt to, and manage the effects of drought in order to enhance resilience of vulnerable populations and ecosystems” detailing the methodology used to estimate drought vulnerability.
Data complying with the specifications listed in table 21.
A pool of national experts officially nominated by the national authorities to verify the consistency of the results of the reporting process against the situation in the field, or to develop and implement a custom methodology to estimate indicator SO 3-3 where national data is preferred to the default data. The key institution in this case is a country’s national statistical office, however universities and research centres may also provide valuable inputs.
3.3.3. Reporting process and step-by-step procedure
The step-by-step procedure for reporting is described in the following. If the default data is used, Steps 2 to 5 are unnecessary.
Step 1: Select tier of vulnerability assessment based on data availability
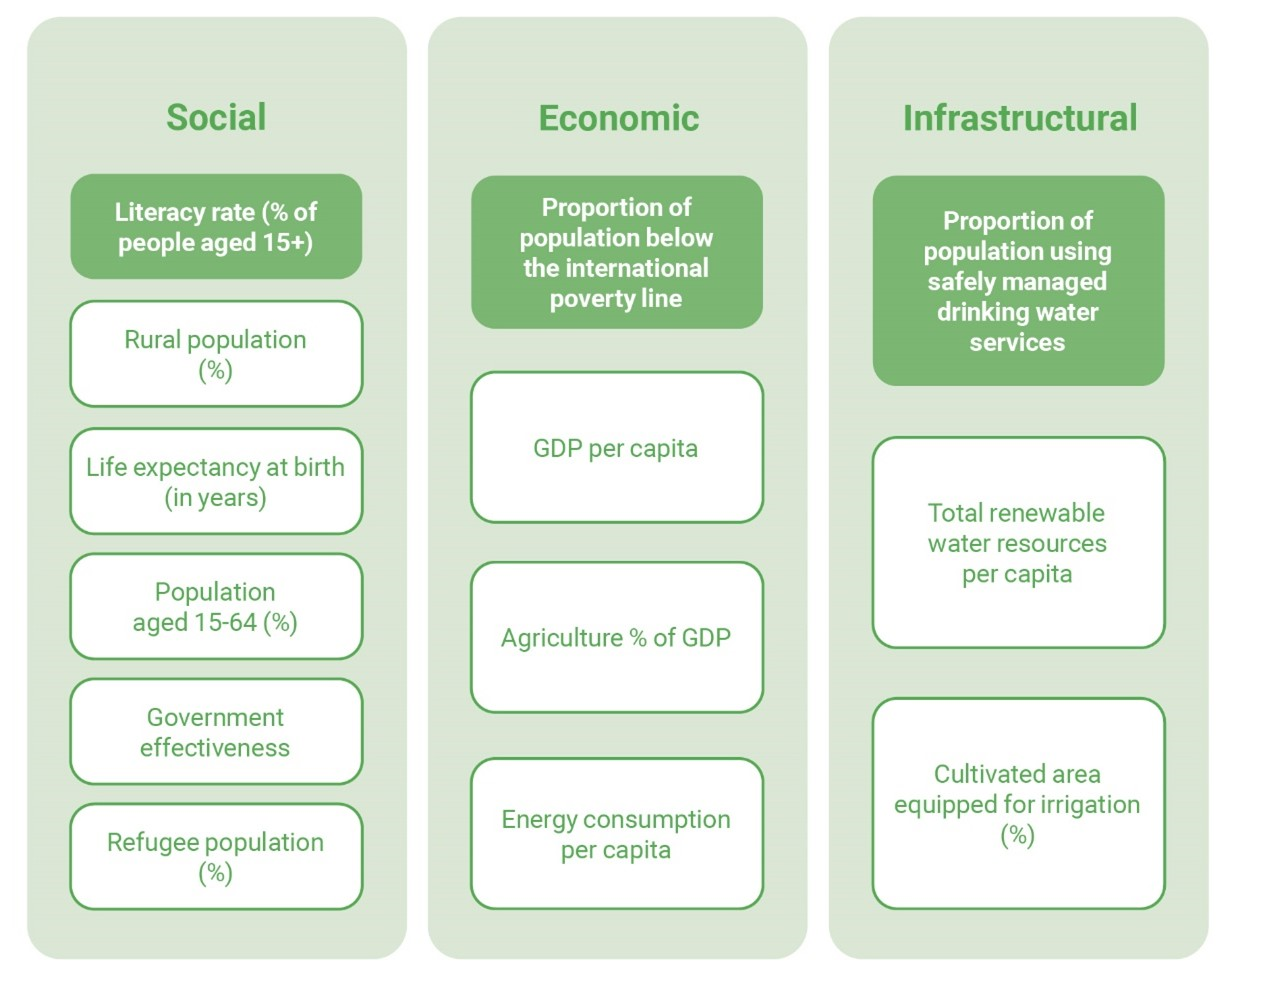
The vulnerability factors (listed in figure 7) recommended by the UNCCD to derive the DVI provide a snapshot of a Party’s socio-economic vulnerability to drought. The three core factors that have been recommended for the minimum Tier 1 VA are:
Literacy rate (% of people aged 15 and above);
Proportion of population below the international poverty line
Proportion of population using safely managed drinking water services.
These were selected because they were identified by experts as critical to understanding vulnerability and due to their use for other reporting requirements such as SO 2 and the Sustainable Development Goals.
Figure 7. Social, economic, and infrastructural components and their associated factors recommended for calculating the Drought Vulnerability Index. Core factors are highlighted in the dark green boxes
The UNCCD provides default data from the global DVI dataset of the JRC. The method used to derive the default DVI is similar to the one presented in this manual and in the “Good Practice Guidance for National Reporting on UNCCD Strategic Objective 3”, but presents some key differences in terms of the normalization method (see Step 2) and number of factors included. Two additional factors are used in the default DVI: “Disaster Prevention and Preparedness (USD/Year/Capital)” and “Global map of Accessibility: Travel time to major cities”. A single default DVI value is provided and represents the median DVI across the country for the period 2000–2018. Therefore, this default value is used to populate the year 2018 in table SO3-3.T1.
Country Parties that do not have data available to calculate the minimum Tier 1 VA can report using the default DVI data. However, it is recommended that efforts are made over successive reporting cycles to move up the tiers of VA in order to increase the sensitivity of the DVI and improve the granularity of the assessment. The decision tree in figure 8 helps Parties select the tier of VA based on data availability.
National/regional data products used to calculate the DVI should conform with the specifications listed in table 21.
Figure 8. Decision tree to help Parties choose the best tier of vulnerability assessment for the SO 3-3 Indicator reporting according to data availability
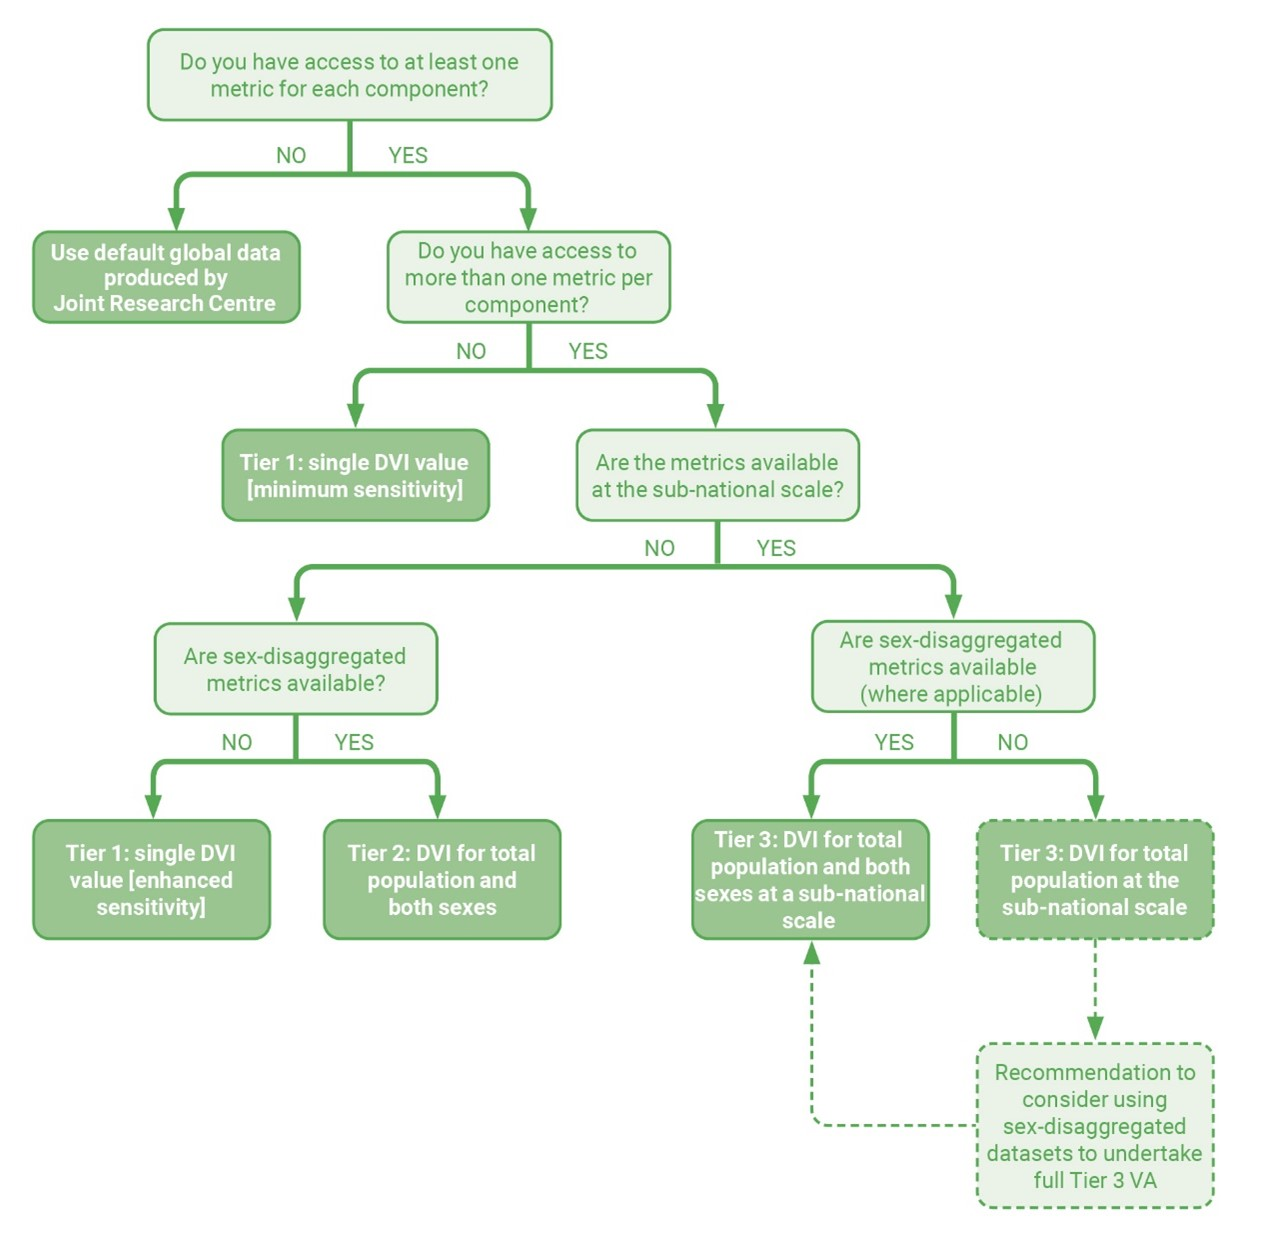
DVI: Drought Vulnerability Index
VA: Vulnerability Assessment
Item |
Specifications |
|
|---|---|---|
Default data (Drought Vulnerability Index dataset produced by the Joint Research Centre) |
National data |
|
Input data Data needed to generate indicator SO 3-3 as described in Steps 2 to 4 |
Input data used to calculate the default Drought Vulnerability Index (DVI) is drawn from various sources such as World Bank, Organisation for Economic Cooperation and Development, Food and Agriculture Organization of the United Nations, and Joint Research Centre of the European Commission. |
Freely available datasets for the calculation of the factors needed to derive the DVI are listed in table 14 of the “Good Practice Guidance for National Reporting on UNCCD Strategic Objective 3”. Alternatively, if available, in-country datasets with higher spatial resolution and fewer gaps over the period 2000-2023. |
Output data DVI indicator resulting from the analysis described in Steps 2 to 4 |
2018 DVI |
Annual or near-annual DVI for the period 2000-2023. |
Classification |
Continuous, fractional scale from 0 to 1 but classification based on quantiles to group the vulnerability classes. |
Continuous scale from 0 to 1. |
Spatial resolution |
Country level |
National and/or sub-national levels |
Quality |
Specified in the dataset metadata. |
To be indicated in the dataset metadata. |
Metadata |
Metadata information is provided with default data. |
Minimum metadata content as per the mandatory fields listed in Annex II. |
Step 2: Factor normalization
In all tiers of VA, factors should be normalized before they can be compared and aggregated, as the vulnerability factors used are all measured using different units.
The Good Practice Guidance for National Reporting on UNCCD Strategic Objective 3 recommends normalizing factors using the maximum and minimum values within the country using all historic data up to and including the latest year for reporting (2023). This provides the largest range possible, ensuring that the maximum and minimum values are representative of the country.
Where there is a positive correlation/relationship between vulnerability and the factor[3] (i.e., if the factor value increases, vulnerability also increases), the data should be normalized using the equation below:
\(Factor = \frac{X_{i} - X_{min}}{X_{max} - X_{min}}\)
Where:
Xi is the value of the considered factor in the year “i”
Xmin is the minimum value of the considered factor observed in the entire time series
Xmax is the maximum value of the considered factor observed in the entire time series
In case of negative correlation/relationship between vulnerability and the factor, the equation is:
\(Factor = 1 - \frac{X_{i} - X_{min}}{X_{max} - X_{min}}\)
After normalization, all factors have a value of between zero and one, relative to the historical maximum and minimum of the country.
Normalization of sex-disaggregated data for Tier 1 and 2 VA uses the same formulae described above, applied once for each piece of sex-disaggregated data.
For sub-national level data (Tier 3 VA), the calculation should be applied to the data from all spatial units (e.g., administrative units) combined, and the factor range should reflect the minimum and maximum values of the whole country.
For the default DVI, each factor was normalized using the global maximum and minimum values, rather than historical ranges for the given country. Normalization at the global scale means the resulting vulnerability assessment is less sensitive to the local/in-country situation than when the national range is used.
Step 3: Derive the Drought Vulnerability Index components
This step aims to derive aggregated values for each of the three DVI components. For Parties that use only one factor per vulnerability component the values of the factor normalized in Step 2 are also representative of the corresponding component. Instead, the use of more than one factor per vulnerability component requires the calculation of the arithmetic mean of the normalized factors to derive the aggregated value of each component.
The result of this step is a single value for each component and each geographic unit of the country. If sex-disaggregated data is used, separate values for male and female populations are produced for each component.
Parties may assign weights to the vulnerability factors if their relative importance and relevance is known. It is recommended to apply the weights to each individual vulnerability factor and not to the three components.
Step 4: Calculate the Drought Vulnerability Index
Note
Related areas in the PRAIS 4 platform: table SO3-3.T1
In all tiers of VA, the three components (Csocial, Ceconomic and Cinfrastructural) derived in the previous steps are used to produce the DVI by calculating their arithmetic mean value.
\(DVI = \frac{C_{\text{social}} + C_{\text{economic}} + C_{\text{infrastructural}}}{3}\)
The DVI ranges from 0 to 1, with 1 being the most vulnerable.
A Tier 1 VA would result in one DVI at country-level for each year where data is available (ideally 2000 to 2023). For Tier 2 and 3 VAs, where sex-disaggregated factors are used, it is recommended that sex-specific DVIs are also calculated, in addition to the country-level DVI. Hence, a Party would report three DVI values for each year available, i.e., for the total, female and male populations. For sub-national or gridded components under Tier 3 VA, the DVI is to be calculated for the smallest spatial unit separately for males, females and total populations. The annual DVI values for males, females and total population should be used to complete table SO3-3.T1.
Step 5: Report factors used to calculate DVI
When national data is used to complete table SO3-3.T1, Parties should also report on the factors used in the calculation. Once any data is entered in table SO3-3.T1, a set of additional tables under the heading “Method” will be made available for completion. For each of the social, economic and structural components, Parties should identify those factors used in the calculation of the DVI. Moreover, Parties should indicate for each factor used, if sex-disaggregated data was available and if calculations were made at a subnational level.
Once the tables have been completed, PRAIS will automatically determine and display the Tier level used in the assessment.
Parties should also provide an indication of how the DVI is changing over time, by selecting one of the options in table SO3-3.T2. Supporting information can be provided in the associated comments field.
Step 6: Verify the results
The DVI method has not yet been validated at the local or national scale and, as such, may not accurately characterize vulnerability at these scales, either in terms of the factors most relevant to each country or the most effective factor weighting scheme. Therefore, Parties may verify the appropriateness of the default factors and add relevant ones as needed. Any weighting scheme used by Parties should also be thoroughly assessed if used to improve results at national and subnational level.
Moreover, the most vulnerable populations and underrepresented groups should be involved in the determination of the factors to be used to calculate the components, in order to develop a country-specific and more effective index.
Step 7: Save form and make available for review
Information on the method used (selected tier and factors per component) should be reported using the dedicated comments field associated with the table SO3-3.T1 in the PRAIS 4 platform. Observed changes and their interpretation may also be described in this field.
Maps generated in Trends.Earth using national data under Tier 3 VA and representing vulnerability to drought over the period analysed can be uploaded to the PRAIS 4 platform. More specifically, it is recommended to upload the following maps:
Drought Vulnerability for the year 2000 or closest available year
Drought Vulnerability for the year 2023 or closest available year
Information on data sources, data accuracy and any weighting scheme applied to the vulnerability factors can be submitted using the “General Comments” field. It would also be beneficial to report on special cases and issues, describing situations where values might be less reliable and providing the rationale for inclusion of different factors.
Once the form has been completed and verified by the Parties, it should be marked as “In Review” and then saved. Once the UNCCD has completed its review and all comments have been resolved, the form can be marked as “Finalized” and then Saved.
3.3.4. Dependencies
SO 2-1 and SO 2-2 can be used for the calculation of SO 3-3. This is explained in the Good Practice Guidance for National Reporting on UNCCD Strategic Objective 3. Chapter 3. Level 3 Indicator.
3.3.5. Challenges
Data availability and quality
The global DVI dataset of the JRC is only available for the year 2018.
The availability of data for the considered factors varies substantially from country to country and the complete set of recommended data might not be accessible everywhere.
Methodological approach
The reliability of the DVI method at national and sub-national levels is still to be verified by national experts.
Due to the methods used for factor normalization (i.e., using in-country historic data), DVI values should not be compared between countries.
Assuming a consistent methodology has been used over time, changes in the DVI may reflect the efficacy of drought mitigation and adaptation policies, but they may also reveal the impacts of social and economic changes disconnected from drought management measures.
3.3.6. Summary (main actions)
Key actions for reporting population vulnerable to drought hazard are as follows:
Select tier of vulnerability assessment based on data availability: Parties are encouraged to opt for one of the three Tiers of VA based on data availability. In the absence of data to calculate the minimum Tier 1 VA, Parties may use the default data. National/regional data products used to calculate the DVI should comply with the specifications listed in table 21. If Parties use national/regional data products, they should follow actions 2 to 4 below:
Factor normalization: factors for each vulnerability component should be normalized before they can be compared and aggregated, as the vulnerability factors used are all measured using different units.
Derive the DVI components: the aggregated values for each of the three DVI components are calculated as the arithmetic mean of the normalized factors.
Calculate the DVI: the three components – social, economic and infrastructural – derived in the previous steps are used to produce the annual DVI values by calculating their arithmetic mean value.
Report factors used to calculate DVI: When national data is used to complete table SO3-3.T1, Parties should also report on the factors used in the calculation.
Verify the results: aware of the fact that the DVI method has not yet been validated at the local or national scale, Parties should verify the appropriateness of the default factors and add relevant ones as needed before officially submitting estimates for UNCCD reporting.
Save form and make available for review: once verified by the Parties, the data and supporting narrative for the period assessed should be marked as “In Review” and saved thereby making it available for review by the UNCCD.