1. Strategic objective 1: To improve the condition of affected ecosystems, combat desertification/ land degradation, promote sustainable land management and contribute to land degradation neutrality
1.1. SO 1-1 – Trends in land cover
1.1.1. Introduction
Land cover refers to the observed (bio)physical cover on the Earth’s surface.
The United Nations Convention to Combat Desertification (UNCCD) methodology for estimating the proportion of land that is degraded over total land area (i.e. Sustainable Development Goal (SDG) indicator 15.3.1) uses land cover change as an indicator of altered ecosystem dynamics resulting from natural and/or artificial drivers and factors.
The main output of the reporting process for indicator SO1-1 is a set of officially verified estimates of the extent of land cover classes, their changes at national level and their significance in terms of land degradation.
National reporting is facilitated though the provision of: (i) default data derived from available global data sources, namely the European Space Agency Climate Change Initiative Land Cover (ESA CCI-LC) products; and (ii) guidance on how to interpret transitions across land cover classes as processes that are likely to reduce the biological or economic productivity and complexity of the land (degradation), improve it, or result in no change (stable).
1.1.2. Prerequisites for reporting
An in-depth reading of chapter 3 of the Good Practice Guidance for SDG Indicator 15.3.1: Proportion of land that is degraded over total land area (version 2), which provides an overview of the land cover indicator, its definition and classifications, and the recommended methodology to assess land cover degradation;
Familiarity with Sections 1 and 3 of the Addendum to Good Practice Guidance for SDG Indicator 15.3.1: Proportion of land that is degraded over total land area (version 2).
Data complying with the minimum standards listed in table 10 below;
A pool of national experts officially nominated by the national authorities to verify the reliability of the identified land cover changes and their links with the main land degradation processes. This may involve ground-truthing surveys and/or organizing interviews with local communities and key informants. Key institutions might include a country’s national statistical office, ministry of environment, ministry of agriculture, ministry of water resources, meteorological department, remote-sensing centre, food security and nutrition department, as well as universities and research centres.
1.1.3. Reporting process and step-by-step procedure
The step-by-step procedure for reporting is described in the following. If Parties decide to use the default data, steps 2, 3, 4, 5 and 6 are unnecessary.
Step 1: Identify key degradation processes
Note
Related areas in the PRAIS 4 platform: table SO1-1.T1
Parties are invited to list the most relevant land cover change processes that are likely to result in land degradation. Key processes might include deforestation, urban expansion or vegetation loss. Some of these processes may be detectable through the image analysis of land cover change, while others may only be evident with field observations. Table 7 shows examples of processes likely to cause land degradation and which are listed as options in the drop-down menu in table SO1-1.T1 of the PRAIS 4 platform. Other processes not covered in the menu can be reported on by selecting the ‘Other’ option and providing a title to describe the degradation process.
Degradation process |
Starting land cover state |
Ending land cover state |
|---|---|---|
Urban expansion |
Grassland, cropland, other land |
Artificial surfaces |
Deforestation |
Tree covered areas |
Grasslands, croplands, artificial surfaces |
Vegetation loss |
Tree covered areas, grasslands, croplands |
Other land |
Inundation |
Vegetated, artificial surfaces, bare soil |
Wetland |
Woody encroachment |
Wetland, grassland |
Tree covered areas |
Wetland drainage |
Wetland |
Grasslands, croplands, artificial surfaces, other lands |
Note: These are simplistic examples and attributing a change in state to degradation requires careful assessment at the national level.
Parties are invited to provide background information, a rationale for the selection of their degradation processes and any further information of relevance in the comments field below the table.
Step 2: Select a land cover legend
Note
Related areas in the PRAIS 4 platform: table SO1-1.T2
Land cover information should be classified using either the default UNCCD legend comprising seven broad land cover classes for aggregate reporting, or a national land cover legend that allows key country-specific degradation processes to be monitored and which can be harmonized with the seven UNCCD land cover classes.
The default UNCCD land cover legend includes the following seven classes: tree-covered areas, grassland, cropland, wetland, artificial surfaces, other land, and water bodies[1].
It is important to highlight that the objective of SO 1-1 reporting is to capture and document past and ongoing key land cover changes causing land degradation, not to report a fully comprehensive national land cover legend which lists all possible land cover classes occurring within a country. Accordingly, a mapping exercise should be undertaken to customize the land cover legend such that it will include only the minimum number of classes needed to capture and monitor land degradation processes reported on in Step 1. To illustrate, during the 2022 reporting cycle, some Parties implemented country-specific adaptations to the land cover legends. See Box 1 to read more on these legend adaptation examples.
Box 1: Country-specific adaptations to the land cover legend
Countries with highly diverse environments and contrasting land degradation processes often require a more detailed land cover classification. In these cases, increasing the number of land cover classes or subdividing the country into regions for tailored analysis is essential. For example, during Colombia’s 2022 reporting process, experts highlighted glacier retreat and snow cover reduction as key degradation processes. To monitor such changes effectively, the standard seven UNCCD land cover classes were insufficient. After careful analysis of national land cover maps, experts determined that a minimum of 12 land cover classes was necessary, including the addition of Permanent Snow and Glaciers.
Even in the absence of national land cover datasets, countries can modify the default land cover legend from the datasets provided by the UNCCD to better align with national dynamics.
The standardized global land cover maps are derived from the ESA-CCI dataset, which originally includes 36 classes but is reclassified and mapped into seven broad categories for aggregate reporting. However, these 36 land cover classes can be re-classified differently to capture key land degradation processes at the national level. For example, Bhutan utilized the default land cover dataset but applied their own reclassification approaches to ensure that shrublands were explicitly represented. In Bhutan, woody encroachment was identified as a significant degradation process, necessitating the differentiation of shrublands from forests. After evaluating various reclassification options, experts adopted a seven-class legend that included shrublands while merging wetlands with water bodies, as Bhutan wetlands were not well mapped in the ESA-CCI dataset.
More details on these and other examples can be found in the chapter entitled “Trends in Land Cover” in the publication The Land Story (UNCCD, 2024).
When the suitable land cover legend has been identified, Parties should click on one of the toggle options related to the question on whether the seven UNCCD land cover classes are sufficient to monitor key degradation processes. If a country selects “No” they should fill in table SO1-1.T2 with national land cover classes showing how they map to the default seven UNCCD land cover classes. Countries are strongly encouraged to build the legend with a limited number of relevant classes and not to exceed 15 land cover classes in total. This will make reporting more manageable, reduce the risk of performance issues on the web browser and would reduce the transitions to be described and reported in Step 3. With reference to the Good Practice Guidance for SDG Indicator 15.3.1, and its associated Addendum the legend should be:
Competent, for capturing the degradation transitions identified as significant;
Usable, such that available observational data can distinguish between the classes in the legend; and
Exhaustive, such that the entire land area of the country can be attributed to classes from the legend and monitored through time.
Wherever possible, UNCCD encourages Parties to use the Land Cover Meta Language (LCML) of the Food and Agriculture Organization of the United Nations (FAO)[2], which provides a structured approach to land cover definition and interpretation. The LCML is the conceptual and structural backbone of various land cover classifications, including the land cover legend used by the ESA CCI-LC products.
Table 8 shows the conversion between the default UNCCD legend and the ESA CCI-LC legend.
UNCCD |
European Space Agency Climate Change Initiative Land Cover |
||
|---|---|---|---|
Code |
Label |
Code |
Label |
1 |
Tree-covered areas |
50 |
Tree cover, broadleaved, evergreen, closed to open (>15%) |
60 |
Tree cover, broadleaved, deciduous, closed to open (>15%) |
||
61 |
Tree cover, broadleaved, deciduous, closed (>40%) |
||
62 |
Tree cover, broadleaved, deciduous, open (15–40%) |
||
70 |
Tree cover, needle leaved, evergreen, closed to open (>15%) |
||
71 |
Tree cover, needle leaved, evergreen, closed (>40%) |
||
72 |
Tree cover, needle leaved, evergreen, open (15–40%) |
||
80 |
Tree cover, needle leaved, deciduous, closed to open (>15%) |
||
81 |
Tree cover, needle leaved, deciduous, closed (> 40%) |
||
82 |
Tree cover, needle leaved, deciduous, open (15–40%) |
||
90 |
Tree cover, mixed leaf type (broadleaved and needle leaved) |
||
100 |
Mosaic tree and shrub (>50%)/herbaceous cover (< 50%) |
||
2 |
Grassland |
110 |
Mosaic herbaceous cover (>50%)/tree and shrub (<50%) |
120 |
Shrubland |
||
121 |
Shrubland evergreen |
||
122 |
Shrubland deciduous |
||
130 |
Grassland |
||
140 |
Lichen and mosses |
||
151 |
Sparse trees (<15%) |
||
152 |
Sparse shrub (<15%) |
||
153 |
Sparse herbaceous cover (<15%) |
||
3 |
Cropland |
10 |
Cropland, rainfed |
11 |
Herbaceous cover |
||
12 |
Tree or shrub cover |
||
20 |
Cropland, irrigated or post-flooding |
||
30 |
Mosaic cropland (>50%)/natural vegetation (tree, shrub, herbaceous cover) (<50%) |
||
40 |
Mosaic natural vegetation (tree, shrub, herbaceous cover) (>50%)/cropland (< 50%) |
||
4 |
Wetland |
160 |
Tree cover, aquatic or regularly flooded in fresh or brackish water |
170 |
Tree cover, aquatic, regularly flooded in salt or brackish water, mangroves |
||
180 |
Shrub or herbaceous cover, flooded, fresh/brackish water |
||
5 |
Artificial surfaces |
190 |
Urban areas |
6 |
Other land |
200 |
Bare areas |
201 |
Consolidated bare areas |
||
202 |
Unconsolidated bare areas |
||
220 |
Permanent snow and ice |
||
7 |
Water bodies |
210 |
Water bodies |
Parties are invited to provide background information, a rationale for the selection of their land cover legend classes and any further information of relevance in the comments field below the table.
Step 3: Generate a transition matrix
Note
Related areas in the PRAIS 4 platform: tables SO1-1.T3
Once the suitable land cover legend is identified, land cover changes can be linked more clearly to processes leading to degradation and improvement of land. By defining a transition matrix, Parties must decide which land cover changes and processes are expected to cause land degradation, improvement or no change (stable).
Table 9 presents an example of a transition matrix for the default UNCCD land cover classes. The matrix shows suggested interpretations of changes in land cover that may result in land degradation, improvement or stability. Parties might use this matrix as a preliminary framework to be evaluated and adjusted through a multi-stakeholder participatory process and in consideration of the national and local conditions.
For completeness, water bodies are also included in the matrix, although the focus of reporting is on total land area for the purpose of calculating SDG indicator 15.3.1. All water body related transitions are set as ‘stable’ by default, but Parties may alter these values if changes in the extent of water bodies during the baseline or the reporting period had a significant impact on land cover. It should be noted that any change in the extent of inland water bodies affects the total land area, which needs to be adjusted accordingly.
FINAL CLASS |
||||||||
|---|---|---|---|---|---|---|---|---|
Tree-covered areas |
Grassland |
Cropland |
Wetland |
Artificial surfaces |
Other land |
Water bodies |
||
ORIGINAL CLASS |
||||||||
Tree-covered areas |
Stable |
Vegetation loss |
Deforestation |
Innundation |
Deforestation |
Vegetation loss |
Stable |
|
Grassland |
Afforestation |
Stable |
Agricultural expansion |
Inundation |
Urban expansion |
Vegetation loss |
Stable |
|
Cropland |
Afforestation |
Withdrawal of agriculture |
Stable |
Inundation |
Urban expansion |
Vegetation loss |
Stable |
|
Wetland |
Woody encroachment |
Wetland drainage |
Wetland drainage |
Stable |
Wetland drainage |
Wetland drainage |
Stable |
|
Artificial surfaces |
Afforestation |
Vegetation establishment |
Agricultural expansion |
Wetland establishment |
Stable |
Withdrawal of settlements |
Stable |
|
Other land |
Afforestation |
Vegetation establishment |
Agricultural expansion |
Wetland establishment |
Urban expansion |
Stable |
Stable |
|
Water bodies |
Stable |
Stable |
Stable |
Stable |
Stable |
Stable |
Stable |
|
Note
Land cover change processes are color coded as improvement (green), stable (yellow) or degradation (purple). Unlikely transitions are written in italics. Note that this is an example of a transition matrix and should not be interpreted as appropriate for countries to adopt without consideration of local conditions and key degradation processes.
Depending on the land cover legend selected in Step 2, Parties will need to provide their interpretation of land cover transitions using table SO1-1.T3 for UNCCD default land cover classes or national land cover classes.
Table SO1-1.T3 gives the option to provide one transition matrix covering the total land area of the country or up to five region specific transition matrices. This may be appropriate where a country has more than one ecoregion and transitions vary regionally. See Box 2 for an example of a country that took this approach in the 2022 reporting. If this option is chosen, Parties should give each added region a unique name and upload a vector file delineating the regional boundary. The relevant land cover transitions for each region should then be defined. The combined land area for the region-specific transition matrices must sum to the total land area for the country. These calculations should be carried out externally to PRAIS in Trends.Earth or another computing environment.
The PRAIS 4 platform includes functions to modify the default transition matrix data and assign a ‘–’ or ‘+’ sign to each transition depending on whether it causes a degradation or improvement of the land according to national circumstances. However, if opting to modify the default transition matrix (i.e. table SO1-1.T3), the transition matrix should first be edited in Trends.Earth so that the reported transitions can be integrated into the calculations of the SO 1-1 outputs and SDG indicator 15.3.1. Editing the transition matrix in PRAIS 4 alone will not result in a recalculation of the spatial data for SO 1-1.
Box 2. Defining regional transition
In Ecuador, experts developed a land cover assessment methodology that divided the country into homogeneous zones, each with distinct environmental characteristics (Figure 2). The proposed zoning included:
Litoral Seco: Areas with ustic or aridic moisture regimes.
Litoral Húmedo: Evergreen forests from the Andean Montane West to the Pacific coast.
Altoandino: Glaciers, páramos, and high-altitude ecosystems (nival and subnival bioclimatic zones).
Valles Interandinos: Inter-Andean valley ecosystems, excluding Altoandino and Litoral Seco.
Amazonía: Evergreen forests from the Andean Montane East to the Amazon basin.
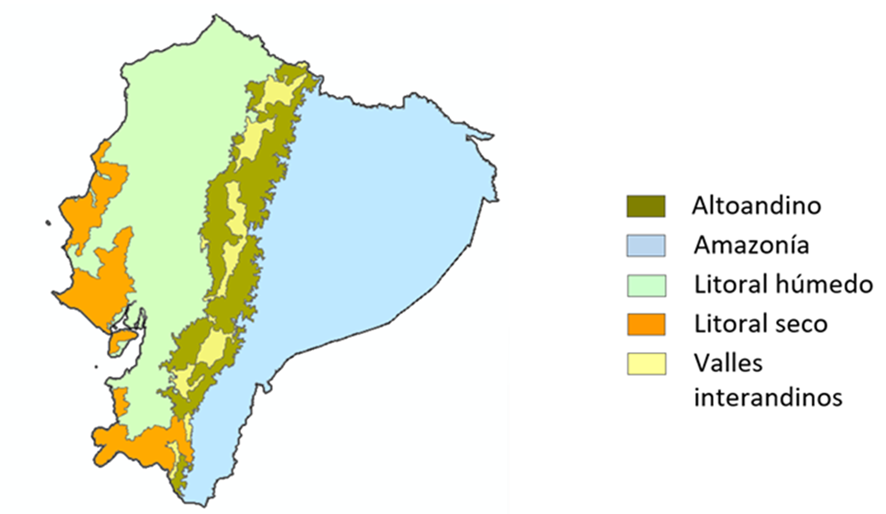
Figure 2. Ecuador defined six subnational ecoregions for which specific transition matrices were established.
Once ecoregions were defined, a specific transition matrix for each zone was established, by incorporating local expertise and stakeholder input. These zone-specific transition matrices ensured that land cover changes were assessed within their ecological and socio-economic context, rather than by applying a uniform classification across the entire country. Finally, the results from each region were integrated to provide a national-level assessment that reflects local realities while maintaining coherence in LDN and SDG indicator 15.3.1 monitoring.
Another example on tailoring the transition matrix can be found in the chapter entitled “Trends in Land Cover” in the publication The Land Story (UNCCD, 2024)
Step 4: Assess available land cover data
Note
Related areas in the PRAIS 4 platform: tables SO1-1.T4
UNCCD provides prefilled default land cover extent data in the PRAIS 4 platform to lighten the reporting burden. This default data comprises a dataset at 300m spatial resolution:
global land cover derived from the latest ESA CCI-LC dataset.
Parties opting to use an alternative source of national data may enter the relevant national annual values in table SO1-1.T4. Parties should click on the “National Data” button above the table in order to edit the table. Basic metadata, as outlined in Annex II, for the datasets to be used should be provided in the Data Sources form that opens when “Edit Data Sources” is selected.
Two additional datasets are available at 30m spatial resolution and are potentially useful for Small Island Developing States (SIDS) reporting:
The Global Land Analysis and Discovery (GLAD) land cover (available for years 2000, 2005, 2010, 2015 and 2020)
The GLC_FCS30D land cover (available every five years from 1985 to 2000, then annually up to 2022)
To help SIDS select the most appropriate land cover map, the Land Cover Comparison Tool for Small Island Developing States[3] facilitates comparison of high-spatial resolution datasets, the generation of agreement-disagreement masks and the generation of transition matrices, among others.
However, Parties may report their estimates using alternative national land cover data if they meet the specifications listed in table 10.
Parties should report the annual land cover extent (in km2) per land cover class for the initial and final years within the baseline and reporting periods in SO1-1.T4 as well as 2019 which is used in the SDG Indicator 15.3.1 2019 status assessment. Please note that due to the absence of default land cover data for the final year of the reporting period (2023) the closest available year (2022) is pre-filled in the 2023 row instead.
Item |
Specifications |
|
|---|---|---|
Default data (European Space Agency Climate Change Initiative Land Cover (ESA CCI-LC) product) |
National data |
|
Type of data |
Based on AVHRR, SPOT, PROBA-V and Sentinel-3 satellite imagery |
Satellite images of finer resolution from national and international sources, airborne imagery and/or field observation and national/provincial statistics |
Classification |
36 land cover classes based on the Food and Agriculture Organization of the United Nations (FAO) Land Cover Classification System (LCCS). For reporting purposes, the 36 ESA CCI-LC classes are aggregated to the seven UNCCD classes (see table 8 of this document for aggregation rules). |
A land cover classification compatible with the seven UNCCD default classes described in step 1. Ideally, the legend is based on the FAO LCCS/Land Cover Meta Language (LCML) methodology. However, the legend should be concise and only include land cover classes of relevance to the reported land degradation processes. |
Temporal coverage |
Annual data from the year 2000 to the year 2022 (2023 not available from the data providers at the time of publication of this manual) |
The minimum requirement is for data at intervals, namely, 2000, 2015, 2019 and 2023, or closest available year. |
Spatial resolution |
300 metres (m) |
The desired spatial resolution is 100m or finer. If such data is not available, it is recommended to use the default data or data with a resolution higher than that of the default data (300m). |
Accuracy |
74% |
To conform with the data quality of the default land cover product, it is recommended to ensure an overall mapping accuracy of at least 74%. |
Metadata |
Metadata information is automatically generated with the default data in Trends.Earth. |
A list of minimum metadata information is listed in Annex II to this document. |
Step 5: Determine the baseline extent of land cover degradation
Note
Related areas in the PRAIS 4 platform: tables SO1-1.T5 and SO1-1.T7
The baseline sets the benchmark against which change in the extent of land cover degradation is compared in subsequent reporting periods. Determining the baseline extent of land cover degradation requires the following three actions:
compare the land cover in the final year of the baseline period (the baseline year, i.e. 2015) with that of the initial year (2000) to estimate what changed (in terms of land cover transitions),
calculate the net area change per land cover class,
infer the land degradation status based on the transition matrix.
Using a consistent baseline is extremely important since it affects the results of change calculations between the baseline and the reporting periods. These changes are used to monitor Parties’ progress on SO 1-1.
Default national estimates of land cover change and land cover degradation for the baseline period are made available in tables SO1-1.T5 and SO1-1.T7 of PRAIS 4, respectively. These estimates can be accepted, adjusted or replaced using national data, as appropriate. Supporting comments should be entered in the comments box provided to justify the modification or replacement of default data. Countries opting to use national data are encouraged to use Trends.Earth for the preparation, analysis and transfer of their data to PRAIS 4. Trends.Earth includes tools to automatically estimate land cover changes and land cover degradation.
Step 6: Estimate land cover degradation for the reporting period
Note
Related areas in the PRAIS 4 platform: tables SO1-1.T6 and SO1-1.T7
Default national estimates of land cover change and land cover degradation for the reporting period are made available in tables SO1-1.T6 and SO1-1.T7, respectively. These estimates are calculated by comparing the land cover in the most recent available year of the reporting period (i.e. ideally 2023, but 2022 for the default data) with that of the initial year of the reporting period (2016). These estimates can be accepted, adjusted or replaced using national data, as appropriate.
If the default estimates are not accepted then by using the selected data, legend and transition matrix, Parties may produce national estimates of (i) land cover change; (ii) land cover degradation; (iii) land cover improvement; and (iv) no change (stability) for the reporting period through Trends.Earth and import the results to the PRAIS 4 platform, where the relevant maps can be created.
Parties are invited to provide background information, a commentary on how land cover change and land cover degradation was calculated and any further information of relevance in the comments field below the tables.
Step 7: Verify the results
The remote-sensing interpretation of land cover changes varies greatly across the globe, strongly influenced by the prevailing climatic conditions and land management practices. This may affect the reliability of applying estimates from global data sources to local areas and require inputs from national experts to identify and highlight situations where the confidence level of the obtained results might be low. Therefore, Parties should identify any false positive and negative situations and report them in the SO 1-4 forms (SDG indicator 15.3.1). This input would contribute to a qualitative assessment of the reliability of the estimates.
Step 8: Save form and make available for review
The PRAIS 4 platform enables the reporting of quantitative information on land cover, land cover changes and land cover degradation. In the absence of more accurate and detailed data at the national level, Parties may officially submit to UNCCD the default estimates. For estimates generated using national data, Parties should provide:
A description of the legend and transition matrix;
National land cover datasets for the baseline and the reporting period;
Land cover change information, including a land cover area change matrix and a spatial dataset or map that shows the areas subject to degradation, improvement or no change based on land cover data.
Information on land cover, land cover changes and land cover degradation should be reported in km2 for the entire country.
If the default datasets have been replaced with national land cover data, countries are encouraged to upload the relevant geospatial data to PRAIS 4. Any spatial data uploaded to the system must be supported by appropriate metadata describing the spatial data, as indicated in the data source form and further described in Annex II of this manual.
Default maps or maps generated in Trends.Earth using national data representing land cover, land cover change and land cover degradation for the baseline/reporting period are made available in the PRAIS 4 platform. More specifically, the following maps will be available online:
Land cover map of the initial year of the baseline period (2000)
Land cover map of the final year of the baseline period year (2015)
Land cover map of the latest reporting year
Land cover change in the baseline period
Land cover change in the reporting period
Land cover degradation in the baseline period
Land cover degradation in the reporting period.
Parties are also invited to submit narratives on methods and processes used and to report on special cases and issues using the ‘General Comments’ field.
Once the form has been completed and verified by the Parties, it should be marked as “In Review” and then saved. Once the UNCCD has completed its review and all comments have been resolved, the form can be marked as “Finalized” and then Saved.
1.1.4. Dependencies
Land cover data is used not only to report on SO 1-1, but also to stratify the indicators on land productivity and soil organic carbon (SOC) (SO 1-2 and SO 1-3) and as one of the sub-indicators to calculate the proportion of land that is degraded over total land area (SO 1-4).
Parties should also note that if a custom land cover legend is reported in SO1-1, the same custom land cover classes can be used to report information on SO1-2 and SO1-3 indicators as well.
The total land area declared under table CP-1.T1 drives the calculation of subsequent reporting elements across the SOs, which will be listed as dependent on table CP-1.T1 in the respective section of this reporting manual. For reporting indicator SO1-1, the ‘Percent of total country area’ field in reporting table SO1-1.T7 is dependent on the total country area reported in table CP-1.T1.
1.1.5. Challenges
Data availability and quality
The GLAD and GLC_FCS30D datasets at 30m spatial resolution that are provided in Trends.Earth and described in the GPG Addendum should be evaluated for suitability by small island developing States (SIDS) and mountainous countries, as these need the highest spatial resolution data. Spatial resolution of default data might not always be suitable to accurately represent land cover and its changes at national level for these areas or countries. Complementing/refining international data analysis with local-scale data, if available, can help improve the quality and reliability of the results.
For analysis and reporting of change in land cover, it is essential to have consistent data (i.e. data derived from the same data source using the same processing technique) over a long period of time; this is often a challenge at both the national and global levels.
The validation of national land cover information may need to be cross-checked in the field, also in consultation with local experts. This might be a time consuming and expensive activity to undertake. Validation carried out using different methods and techniques (e.g. samples of field work with existing aerial photography, free high-resolution images available in Google Earth) could considerably reduce costs and resource allocation.
Land cover classification
National land cover legends and regional transition matrices may be more accurate in capturing local degradation processes and land cover transitions, but might increase the number of possible land cover transitions to be described to an unmanageable amount. While it is important to include the key land cover transitions in a country, a balance between precision and manageability of the information should be considered.
Existing national land cover maps and data need to be converted to the seven UNCCD classes. The required aggregation of land cover classes to the seven UNCCD classes can partly degrade the quality of the original data. Documenting the uncertainties and generalizations applied to harmonize data with international standards may inform the conversion process and the accuracy of the outputs.
Land cover information provided to UNCCD should be consistent over time; changes in the land cover classification methodology require recalculations of previously submitted national estimates.
1.1.6. Summary (main actions)
Key actions for reporting on land cover changes are as follows:
Identify the key land degradation processes through the appropriate consultative process and insert the results in table SO1-1.T1.
Select a land cover legend, ensuring compatibility with the UNCCD default legend. Insert the legend in table SO1-1.T2 if different from the UNCCD default legend.
Generate one or more transition matrices. For each land cover transition, indicate whether it is likely to lead to degradation, improvement or stable conditions. Parties can provide one transition matrix covering the total land area of the country or up to five region-specific transition matrices. The combined land area for the region-specific transition matrices must sum to the total land area for the country. Enter this information in table SO1-1.T3
Select land cover data to be used: ensure compliance with the minimum specifications listed in table 10.
Determine the baseline extent of land cover degradation using the selected data, legend and transition matrix for the baseline period 2000–2015. If national land cover data is used, run the calculations in Trends.Earth and enter this information in tables SO1-1.T5 and SO1-1.T7.
Estimate land cover degradation in the reporting period using the selected data, legend and transition matrix for the reporting period. If national land cover data is used, run the calculations in Trends.Earth and enter this information in tables SO1-1.T6 and SO1-1.T7.
Verify the results: It is recommended that land cover and related land degradation estimates are verified by the concerned national authorities to assess the accuracy of the results and identify any false positive and negative situations which can be reported in the SO 1-4 forms (SDG indicator 15.3.1).
Save form and make available for review: Verify the accuracy of the quantitative information entered in the report and include the narrative information on methods and process used in the various comment fields provided. Then, the data and supporting narrative should be marked as “In Review” and saved thereby making it available for review by the UNCCD.
1.1.7. Additional Resources
UNCCD, (2024), The Land Story: Country experiences with reporting on land degradation and drought, Chapter: Trends in Land Cover (https://www.unccd.int/resources/publications/land-story-country-experiences-reporting-land-degradation-and-drought)
Di Gregorio, A., & Jansen, L.J.M. (2016). Land cover classification system (LCCS). Classification concepts and user manual for software version 3.0. Rome: FAO (https://www.fao.org/geospatial/resources/tools/land-cover-toolbox/en/).
Using land-cover information to monitor progress on Sustainable Development Goal 15, FAO eLearning Course (2024) (https://elearning.fao.org/course/view.php?id=1098)
1.2. SO 1-2 – Trends in land productivity or functioning of the land
1.2.1. Introduction
Land productivity is the biological productive capacity of the land: the principal source of the food, fiber and fuel that sustains humans. The UNCCD methodology for estimating the proportion of land that is degraded over total land area (i.e. SDG indicator 15.3.1) uses changes in land productivity as an indicator of long-term variations in the health and productive capacity of the land. Land productivity reflects the net effects of changes in ecosystem functioning on plant and biomass growth.
Land productivity is calculated from Earth Observation data representing net primary productivity (NPP). Vegetation indices, such as the Normalized Difference Vegetation Index (NDVI) or the Enhanced Vegetation Index (EVI), are often used as proxies for NPP.
The main output of the reporting process for indicator SO 1-2 is a set of officially verified estimates of the extent of five classes of persistent land productivity trajectories within each land cover type and their significance in terms of land degradation.
Although trends in land productivity for the previous reporting period (2016 – 2019) are not required in this report, they will be needed for estimating SDG Indicator 15.3.1 for the period 2016 – 2019 in relation to SO1-4. Therefore, countries are encouraged to estimate LPD trends for the three periods (i.e., baseline and two reporting periods) to ensure consistency in SDG 15.3.1 reporting.
National reporting is facilitated though the provision of default data derived from available global data sources, namely the Trends.Earth Land Productivity Dynamics (LPD) dataset.
1.2.2. Prerequisites for reporting
An in-depth reading of Section 1 and Section 3 of the Addendum to Good Practice Guidance for SDG Indicator 15.3.1: Proportion of land that is degraded over total land area (version 2), which details a number of methodological approaches to calculating land productivity changes;
Familiarity with chapter 4 of the Good Practice Guidance for SDG Indicator 15.3.1 providing an overview on land productivity and detailing one methodology that may be used to estimate land productivity changes;
Data complying with the specifications listed in table 11 below;
A pool of national experts officially nominated by the national authorities to verify the consistency of the land productivity default data against the situation in the field, or to develop and implement a custom methodology to estimate the three land productivity metrics if national data are preferred to the defaults. Key institutions might include a country’s national statistical office, ministry of environment, ministry of agriculture, remote-sensing centre as well as universities and research centres.
1.2.3. Reporting process and step-by-step procedure
The step-by-step procedure for reporting is described in the following. If the default data is used, steps 1 to 7 are unnecessary.
Step 1: Select land cover legend to stratify land productivity
If a custom land cover legend was reported in SO1-1.T2, then there is an opening question on the form that Parties must answer. They should decide whether to stratify this indicator using the seven UNCCD land cover classes or the custom land cover legend used for SO1-1 reporting.
Note: if answering ‘Yes’, the subsequent tables will be dynamically updated with the names of the custom land cover classes, replacing the default UNCCD seven classes.
Step 2: Select Earth observation dataset
UNCCD provides default data from the Trends.Earth LPD dataset. This LPD dataset is derived from the Moderate Resolution Imaging Spectrometer (MODIS) data, which integrates NDVI observations at 250 metre (m) pixel resolution over 16-day periods between 2001 to now.
Two alternative data sets, the JRC LPD and the FAO-WOCAT LPD are available through Trends.Earth. Parties may evaluate and use these or other datasets, provided they meet the specifications listed in table 11 below. The GLOBAL LPD Comparison App available through Google Earth Engine may be used by Parties for this purpose. For example, during the 2022 reporting process Bhutan used this tool to compare a series of land productivity maps generated using EO data but varying algorithmic approaches. During a participatory workshop, participants examined the various maps and by pooling their expert knowledge and the outcomes of the analysis, they were able to choose a map which aligned most closely with the known situation in the country. This example is described in more detail in The Land Story (UNCCD, 2024).
Parties may also generate their own vegetation index time series and consequently LPD input datasets directly from satellite imagery. Two additional apps deployed in Google Earth Engine that may be used to visualise alternative LPD parameterizations are the Real Time LPD App and high-resolution version for SIDS. Section 3.2 of the Addendum to the Good Practice Guidance provides comprehensive information and guidance on the selection of LPD input datasets and LPD algorithms.
Item |
Specifications |
|
|---|---|---|
Default data (Trends.Earth Land Productivity Dynamics (LPD) dataset) |
National data |
|
Input data Data needed to generate land productivity estimates based on the three metrics described in Step 5 |
Time series of daily MODIS satellite images used to calculate Normalized Difference Vegetation Index (NDVI) (MOD13Q1) composited for periods of 10 days (needed to generate the Trends.Earth LPD data) |
Time series of appropriate vegetation index derived from satellite images with at least one red and one near infrared spectral band. |
Output data Gridded products resulting from the analysis and combination of the three metrics described in Step 5 |
Five classes of persistent land productivity trajectories and land productivity degradation gridded data for the baseline period (2000–2015) and the reporting period (2008–2023) |
Five classes of persistent land productivity trajectories and land productivity degradation gridded data for the baseline period (2000–2015) and the reporting period (2008–2023) |
Classification |
Five classes of persistent land productivity trajectories and one class for areas without valid land productivity data:
|
Six classes compatible with those used by the Trends.Earth LPD:
|
Spatial resolution |
250 m |
250m spatial resolution is recommended if data at a finer resolution is not available. |
Quality |
Specified in the metadata of the dataset. Overall, the assessed accuracy of the dataset is >80%. |
To conform with the data quality of the default dataset, it is recommended to ensure an overall mapping accuracy of at least 80%. |
Metadata |
Metadata information is automatically generated with the default data. |
Minimum metadata content as per the mandatory fields are listed in Annex II. |
Step 3: Select a productivity index
The NDVI is recommended as the default index for countries to use in the absence of evidence to indicate that an alternative index is better suited to their landscape. Although NDVI is the most widely used and well-known vegetation index, its main limitations are that it can be sensitive to variations in soil background conditions and that it tends to saturate at high vegetation cover and biomass levels. This can reduce the accuracy of NPP, biomass and green cover models in tropical rainforest or arid regions.
Other indices, such as the Enhanced Vegetation Index (EVI) or Soil Adjusted Vegetation Index (SAVI), may also be suitable. Although some of these indices may perform better than NDVI under specific vegetation conditions, they may require additional adjustment when applied to vast areas and different land cover types. Consequently, despite its limitations, NDVI is currently considered the universal option for regional- and national-level land productivity calculation, considering that extensive research has demonstrated the strong relationship between NDVI and primary productivity. For a more in-depth discussion of different vegetation indices, consult section 3.2.1 of the Addendum to the Good Practice Guidance for SDG Indicator 15.3.1.
Step 4: Estimate annual productivity
The estimation of annual productivity should take into consideration that, due to the natural cycles of growth and senescence of vegetation, NPP is best represented by a time series of observations captured during the full growing season. Therefore, for each pixel location, the annual productivity will be the integral of values from the start to the end of the growing season of the selected productivity index. Areas with increasing NPP should be interpreted as improving, unless assessed otherwise at country level.
Further indications on options to estimate the start and length of the growing season are given in section 4.2.4.1 of the Good Practice Guidance for SDG Indicator 15.3.1. Section 3.2.1 of the Addendum provides additional considerations on how to estimate annual productivity, including developments in enhancing the assessment in hyperarid areas.
Step 5: Calculate land productivity metrics
There are various approaches to determining changes in land productivity over time. Three algorithmic approaches are described in section 3.2.2 of the Addendum and these may be explored with various data sets using the apps deployed in Google Earth Engine, mentioned in step 2 above.
The Trends.Earth LPD algorithm is the one implemented on the default data available through PRAIS. It estimates changes in productivity over time based on the multi-temporal analysis of the annual productivity using three metrics:
Trend/Trajectory: measures the trajectory of change in annual productivity over the long term per pixel;
State: compares the current to historical annual productivity per pixel;
Performance: evaluates local annual productivity over an area compared with other areas with a similar land productivity potential.
The changes observed in each of the three metrics are combined to determine persistent land productivity trajectories represented in five classes (see table 13 below). They are also used to determine whether a pixel is degraded, improved or stable in the baseline and reporting periods (see Step 6).
Instead of the z-score approach described in the UNCCD Good Practice Guidance, the implementation in Trends.Earth uses alternative statistical methods for calculating the “trend” and “state” metrics, as described below. These methods are less sensitive to outliers and annual fluctuations, providing more robust and interpretable results for national and global reporting.
Productivity Trend
To calculate the productivity Trend (also known as Trajectory), Parties should determine the trajectory of change in productivity over a 16-year time interval on a pixel level. The Trend metric is calculated over an interval of 16 years for both the baseline (2000–2015) and the reporting period (i.e. a 16-year period ending in the last year of data being reported (i.e. 2008–2023).
The Trend metric is calculated by fitting a linear regression model to the time series and determining the significance of the trend slope using a Mann-Kendall significance test. Trends with p \(\le\) 0.05 are considered significant, which if positive are considered potential improvement and if negative are considered potential degradation. Parties who wish to use this approach within Trends.Earth also have the option to apply corrections to account for climatic variability, especially rainfall.
Productivity State
Productivity State is determined by comparing the mean annual NPP of the three most recent years to the distribution of annual NPP values observed in the preceding 13 years. More specifically, this entails comparing values for the years 2013–2015 with the years 2000–2012 for the baseline, and the 3 most recent years with the preceding 13 years for the reporting period.
While it is recommended to maintain a 13-year historical period and a 3-year recent comparison period for consistency and comparability, the length of the two periods can be parameterized in the Trends.Earth software to suit specific conditions.
The vegetation index values are then grouped into percentile classes to detect shifts in productivity:
A drop of \(\ge\) 2 classes between the historical period and the recent comparison period suggests potential degradation;
A rise of \(\ge\) 2 classes between the historical period and the recent comparison period indicates potential improvement;
Small changes reflect stability.
Productivity Performance
In contrast to Trend and State, which are temporal metrics, productivity Performance is a spatial metric involving benchmarking the level of local plant productivity relative to other land units (i.e. other pixels) within the same Land Cover/Ecosystem Functional Unit (LCEU)[4].
Within each ecological unit, productivity values are ranked, and areas falling below 50% of their unit’s 90th percentile are flagged as potentially degraded.
The productivity Performance in the reporting period should be calculated from the mean of the annual productivity assessments over the previous 16 years up to the current year, i.e. 2008 to 2023, for the current reporting period.
Step 6: Combine productivity metrics to assess land productivity dynamics in the baseline and reporting period
Note
Related areas in the PRAIS 4 platform: tables SO1-2.T1 and SO1-2.T2
The outputs obtained from the three metrics are used to estimate the land productivity dynamics in both the baseline and the reporting period, as shown in table 12.
Trends in Land Productivity |
||||
|---|---|---|---|---|
Period |
Trend / Trajectory |
State (16 years) |
Performance |
|
Baseline |
Comparison Period |
|||
Baseline: |
2000-2015 |
2000-2012 |
2013-2015 |
2000-2015 |
Reporting Period 1: |
2004-2019 |
2004-2016 |
2017-2019 |
2004-2019 |
Reporting Period 2: |
2008-2023 |
2008-2020 |
2021-2023 |
2008-2023 |
Table 13 summarizes the combinations of productivity metrics to determine the land productivity dynamics and ultimately the land productivity degradation status of each pixel and their relationships. The metrics can be combined into five classes of persistent land productivity dynamics and three classes of land productivity degradation (i.e. ‘improving’, ‘stable’, ‘degrading’).
Parties may use this table to combine custom Trend, State and Performance results derived from national data to estimate land productivity dynamics and degradation.
Changes observed in the three input productivity metrics |
Land productivity dynamics and land productivity degradation status derived from the combination of the three productivity metrics |
||||
|---|---|---|---|---|---|
Class combination |
Trend |
State |
Performance |
Land productivity dynamics (5 classes) |
Land productivity degradation status (3 classes) |
1 |
Improving |
Improving |
Stable |
Increasing |
Improving |
2 |
Improving |
Improving |
Degraded |
Increasing |
Improving |
3 |
Improving |
Stable |
Stable |
Increasing |
Improving |
4 |
Improving |
Stable |
Degraded |
Increasing |
Improving |
5 |
Improving |
Degrading |
Stable |
Increasing |
Improving |
6 |
Improving |
Degrading |
Degraded |
Moderate decline |
Degrading |
7 |
Stable |
Improving |
Stable |
Stable |
Stable |
8 |
Stable |
Improving |
Degraded |
Stable |
Stable |
9 |
Stable |
Stable |
Stable |
Stable |
Stable |
10 |
Stable |
Stable |
Degraded |
Stable but Stressed |
Stable |
11 |
Stable |
Degrading |
Stable |
Moderate decline |
Degrading |
12 |
Stable |
Degrading |
Degraded |
Declining |
Degrading |
13 |
Degrading |
Improving |
Stable |
Declining |
Degrading |
14 |
Degrading |
Improving |
Degraded |
Declining |
Degrading |
15 |
Degrading |
Stable |
Stable |
Declining |
Degrading |
16 |
Degrading |
Stable |
Degraded |
Declining |
Degrading |
17 |
Degrading |
Degrading |
Stable |
Declining |
Degrading |
18 |
Degrading |
Degrading |
Degraded |
Declining |
Degrading |
Note: The last column illustrates how a pixel’s land productivity degradation status can be inferred from the class of land productivity dynamics obtained from the combination of the three input productivity metrics.
National estimates of land productivity dynamics by land cover type should be reported using tables SO1-2.T1 and SO1-2.T2 of the PRAIS 4 platform for the baseline and reporting periods, respectively.
Parties opting to use an alternative source of national data instead of the default should click on the “National Data” button above the tables in order to edit the tables. Basic metadata, as outlined in Annex II, for the datasets to be used should be provided in the Data Sources form that opens when “Edit Data Sources” is selected.
Step 7: Combine productivity metrics to assess land productivity degradation in both the baseline period and reporting period
Note
Related areas in the PRAIS 4 platform: table SO1-2.T3
The outputs obtained from the three metrics are used to estimate the extent of the improved, stable and degraded land in the baseline period and in the reporting period. Table 13 above shows how to transform the outputs of the three metrics into three classes (improved land, stable land, degraded land) to assess the land productivity degradation status (last column) in the baseline period and the reporting period.
The total area of land productivity degradation in the baseline period and in the reporting period should be reported in table SO1-2.T3 of the PRAIS 4 platform.
Further details and clarifications of the process used may be provided in the associated comments field.
Parties should also indicate if a sub-national (regional) assessment was used in generating this indicator using the toggle boxes provided. Parties may elect to carry out a subnational analysis if a national-level LPD assessment is deemed insufficient to capture the diversity of land productivity trends across different ecological zones. Countries with highly diverse landscapes may benefit from conducting a subnational analysis by defining regions where alternative vegetation indices (VIs) or differently parameterized LPD models can be applied. When conducting subnational assessments, it is recommended that the same delineation is used for all three SDG 15.3.1 sub-indicators, that the number of regions remains manageable (ideally fewer than five), and that their boundaries align with recognizable administrative or ecological units. These areas should be clearly mapped and documented. Subnational analysis is discussed in more detail in section 3 of the Addendum to the Good Practice Guidance for SDG Indicator 15.3.1.
Step 8: Verify the results
Verification of the results involves choosing the most reliable LPD map to ensure the accuracy of the final land degradation map. To facilitate such verification, Parties may choose to compare the results of alternative LPD datasets using additional datasets that can help with a qualitative assessment of the results. Section 3.2.1 of the Addendum provides several examples of how Parties have carried out this verification process in the previous reporting round. A summary of these is provided in Box 4.
Step 9: Save form and make available for review
Parties are also encouraged to submit narratives on the methodology, data sources and data accuracy in case the estimates are derived from national data. It would also be beneficial to report on special cases and issues, describing any deviation from the default method and providing the rationale for the adoption of a different methodology. A general comments field is provided at the end of the reporting form in the PRAIS 4 platform for this purpose.
Information on land productivity dynamics and land productivity degradation should be reported in km2 for the entire country.
If the default datasets are replaced with national land productivity data, countries are encouraged to make the relevant geospatial data and relevant metadata available in the PRAIS 4 platform.
Maps generated with default or national data on land productivity dynamics and land productivity degradation for the baseline and the reporting period will be created on the PRAIS 4 platform. These maps will include:
Land productivity dynamics in the baseline period
Land productivity dynamics in the reporting period
Land productivity degradation in the baseline period
Land productivity degradation in the reporting period.
Once the form has been completed and verified by the Parties, it should be marked as “In Review” and saved. Once the UNCCD has completed its review and all comments have been resolved, the form can be marked as “Finalized” and then Saved.
1.2.4. Dependencies
Land productivity data relies on the land cover data reported under SO 1-1 to disaggregate land productivity classes. The ‘per cent of total land area’ field in reporting tables SO1-2.T3 is dependent on the total land area reported in table CP-1.T1.
1.2.5. Challenges
Data availability and quality
Spatial resolution of international data might not always be suitable to produce a sufficiently detailed representation of the land productivity dynamics at the national level, especially for SIDS or mountainous countries. Alternative LPD datasets including those that may be appropriate for SIDS are discussed in the Addendum to the Good Practice Guidance (section 3.2.3).
Land productivity in certain climatic zones where the annual growing season is highly variable or erratic, or where there is sparse or no vegetation, is difficult to accurately measure, resulting in no data for these areas. Areas of dense vegetation and year-round growth, as in the humid tropics, can also show little variation in productivity, making data unreliable. A discussion of efforts to enhance the assessment of land productivity in hyperarid areas can be found in the Addendum to the Good Practice Guidance (section 3.2.1).
Analytical approach
Even when the same input dataset is used, applying different algorithms can lead to varying results due to differences in methodology. Furthermore algorithm parameters can be fine-tuned meaning that even the same LPD algorithm applied to the same input dataset can produce different outputs depending on how it is parametrized. Countries are encouraged to explore these parameters in consultation with experts and stakeholders to ensure that the final results align with national knowledge and objectives.
It is important to consider that applying a 16-year window for the reporting period of land productivity versus an 8-year window for land cover and SOC stock changes will likely increase the impact of productivity (compared to the other indicators) when they are combined to derive the SDG indicator 15.3.1.
1.2.6. Summary (main actions)
Key actions for reporting on land productivity dynamics are as follows:
Select land cover legend to stratify land productivity: Decide whether to stratify this indicator using the seven UNCCD land cover classes or a custom land cover legend, if such a legend was reported in SO1-1.T2;
Select Earth Observation dataset: UNCCD makes available default data, which may be verified and officially accepted. If Parties decide to use alternative data sources, they should verify the compliance with the minimum requirements listed in table 11 and follow actions 3 to 6 below;
Select a productivity index: NDVI is recommended as the default index; however, countries may choose alternative indexes that are better suited to their local land productivity dynamics; Parties may choose to carry out subnational analyses;
Estimate annual productivity: For each pixel, estimate the annual productivity as the integral of values from the start to the end of the growing season of the selected productivity index;
Calculate land productivity metrics: For each pixel, estimate Trend (Trajectory), State and Performance metrics;
Combine productivity metrics to assess land productivity dynamics and therefore degradation in the baseline and reporting periods: Using table 12 as a guide, combine the metrics to determine the land productivity dynamics (five classes of persistent land productivity trajectories) and the land productivity degradation status in the baseline and reporting period (three classes of degradation status). If national land productivity data is used, run the calculations in Trends.Earth and enter this information in the tables;
Verify the results: It is recommended that land productivity and related land degradation estimates are verified by the concerned national authorities to assess the accuracy of the results and to identify any false positive and negative situations which can be reported on in the SO 1-4 forms (SDG indicator 15.3.1);
Save form and make available for review: Once verified by the Parties, the data and supporting narrative for the reporting and baseline periods should be marked as “In Review” and saved thereby making it available for review by the UNCCD.
1.2.7. Additional Resources
UNCCD, (2024), The Land Story: Country experiences with reporting on land degradation and drought, Chapter: Trends in Land Productivity (https://www.unccd.int/resources/publications/land-story-country-experiences-reporting-land-degradation-and-drought)
García, C. L., Pozzi Tay, E. F., Raviolo, E., Paredes-Trejo, F., Francis, R., & James, C. (2025). Land Cover Trends in SIDS: Supporting UNCCD 2026 reporting process and SDG indicator 15.3.1 monitoring. Zenodo. https://doi.org/10.5281/zenodo.15276250
Cherlet, M., Hutchinson, C., Reynolds, J., Hill, J., Sommer, S., von Maltitz, G. (Eds.), World Atlas of Desertification, Publication Office of the European Union, Luxembourg, 2018.
Trends.Earth website documentation (https://docs.trends.earth/en/latest/index.html).
1.3. SO 1-3 – Trends in carbon stocks above and below ground
1.3.1. Introduction
Carbon stocks reflect the integration of multiple processes affecting plant growth as well as decomposition, which together control the gains and losses from terrestrial organic matter pools. They are elementary to a wide range of ecosystem services, and their levels and dynamics are reflective of soil type, land use and management practices.
As outlined in the UNCCD decision 22/COP.11, soil organic carbon (SOC) stock is the metric currently used to assess carbon stocks and will be replaced by total terrestrial system carbon stock once operational.
The UNCCD methodology for estimating the proportion of land that is degraded over total land area (i.e. SDG indicator 15.3.1) uses SOC stock as an indicator of overall soil quality associated with soil nutrient cycling, soil aggregate stability and soil structure, with direct implications for water infiltration, vulnerability to erosion, and ultimately the productivity of vegetation, and in agricultural contexts, yields.
The main output of the reporting process for SO 1-3 is a set of officially verified estimates of SOC stock in the top 30 centimetres (cm) of soil (in tonnes per hectare) for each of the seven UNCCD land cover classes, or for an alternative set of national land cover classes, and their significance in terms of land degradation. The SOC stock is estimated for the baseline period (2000 to 2015) and for the current reporting period (2016 to 2023).
Although SOC changes for the previous reporting period (2016 – 2019) are not required in this report, they will be needed for estimating SDG Indicator 15.3.1 for the period 2016 – 2019 in relation to SO1-4. Therefore, countries are encouraged to estimate SOC changes for the three periods (i.e., baseline and two reporting periods) to ensure consistency in SDG 15.3.1 reporting.
National reporting is facilitated through the provision of default reference (2000) data derived from the International Soil Reference and Information Centre (ISRIC) SoilGrids250m dataset, and default estimates of SOC stock changes are derived using a modified Tier 1 Intergovernmental Panel on Climate Change (IPCC) methodology for compiling national greenhouse gas inventories for mineral soils.
Parties may complement/replace these data with national data (Tier 2 method), determining SOC stocks from high spatial resolution digital soil maps or from field measurements. Parties with capabilities in using more complex methods of reporting SOC stocks involving ground measurements and modelling can adopt the Tier 3 method.
1.3.2. Prerequisites for reporting
An in-depth reading of chapter 5 of the Good Practice Guidance for SDG Indicator 15.3.1, which provides basic information on the processes regulating the formation and release of SOC stocks and detailing the methodology used to estimate SOC changes;
Familiarity with Section 1 and Section 3 of the Addendum to Good Practice Guidance for SDG Indicator 15.3.1: Proportion of land that is degraded over total land area.
Data complying with the minimum standards listed in table 14 below;
A pool of national experts officially nominated by the national authorities to verify the results of the SOC analysis or develop and implement a custom methodology if national data is used instead of the defaults. Key institutions might include a country’s national statistical office, ministry of environment, ministry of agriculture (especially the soil department), remote-sensing centre, as well as universities and research centers;
An understanding of the Tier levels of reporting and a decision on what Tier level is appropriate for the country before commencing the reporting process. Chapter 5 of the Good Practice Guidance for SDG Indicator 15.3.1 presents comprehensive information on the Tier levels.
1.3.3. Reporting process and step-by-step procedure
For the 2026 national reporting process, the following information for SO1-3 is needed:
Soil organic carbon stocks for each of the land cover classes used in the years 2000, 2015, 2019, and 2023. These represent the reference year (2000) and the end years of the baseline and two most recent reporting periods;
The Tier level used to estimate the SOC;
SOC stock degradation status for the baseline period and latest reporting period, with numerical estimates of areas that are improved, stable, and degraded. Additionally, areas where no data is available can be reported.
The PRAIS 4 platform includes prefilled tables of the above information based on estimates derived from default data (see Table 14) but also allows Parties to enter their own SOC data in the reporting tables.
The step-by-step procedure for reporting is described below. If the default data is used, steps 2 to 5 are unnecessary.
Step 1: Select tier for SOC assessment based on data availability
Parties may use any one of the following three methods to determine reference SOC stocks and estimate changes in SOC stocks for the baseline and reporting periods. These methods are consistent with the IPCC guidelines[6] and include datasets and processing options with increasing levels of accuracy and complexity.
Tier 1
The UNCCD uses a modified Tier 1 approach to pre-fill the tables SO1-3.T1 and SO1-3.T2. This approach uses broad methods with default values and is valuable when country-specific data that meet the minimum requirements is unavailable. The default reference (2000) estimates of SOC stocks provided by the UNCCD are based on a global map of SOC stock (ISRIC´s SoilGrids250m). The estimate of changes in SOC stock for the baseline (2000 - 2015) and reporting periods (2016- 2019, 2016 - 2023) uses this global map combined with land cover change and default SOC conversion coefficients from the IPCC.
As an alternative to using the default data, Parties may choose to implement a Tier 1 approach using their own data. In this case they should be aware of the following.
The estimation of reference SOC stocks (2000) follows IPCC guidelines:
They use broad global estimate of default SOC stocks under natural vegetation for mineral soils,
They are stratified by climate/soil type,
They use default land management factors,
A delineation of wetland areas acts as a proxy for organic soils.
The estimation of changes in SOC stocks for the baseline (2000 - 2015) and reporting periods (2016- 2019, 2016- 2023):
Uses information on land cover change (as a proxy for land use change) to make associations with changes in carbon stocks,
These changes in SOC stocks are estimated using conversion coefficients for land cover transitions,
Carbon losses in organic soils are determined using default annual carbon emission factors following drainage and/or fires.
See chapter 5 of the Good Practice Guidance for SDG Indicator 15.3.1, for more details of the Tier 1 approach to estimate SOC stock and SOC change values.
Tier 2
This tier uses additional country-specific data to improve the specification of any components of the Tier 1 method.
Options to improve estimation of baseline SOC stocks include:
Use of high spatial resolution digital soil maps,
Use of any measurements from soil surveys,
Incorporation of country-specific management categories,
Stratification of a country into climate regions and/or soil types.
Options to improve estimation of changes in SOC stocks include:
Assess spatial and temporal validity of default land cover change and land management change,
Use stock change coefficients with country-specific values,
Use regression modelling to predict SOC stock using a range of environmental factors,
For organic soils use country-specific emission factors.
A detailed description of the Tier 2 method is provided in section 5.2.6.2 of the Good Practice Guidance for SDG Indicator 15.3.1. In addition, section 3.3.1 of the Addendum provides additional guidance and examples of how some countries upgraded to Tier 2 methods and therefore improved estimations of SOC during the 2022 reporting cycle. For example, Türkiye used national expert knowledge, in addition to modelling and the inclusion of nationally representative information in the determination of realistic and robust SOC conversion coefficients for different land cover transitions (UNCCD, 2024).
Tier 3
This tier is more complex and involves national ground measurements and modelling.
Generally, it uses nationally derived land cover classes and data for baseline SOC stocks, change coefficients and emission factors or incorporates national data based on the integration of ground-measurement programmes, Earth Observation and models.
Comprehensive guidance on the application of all the tiers is provided in chapter 5 of the Good Practice Guidance for SDG Indicator 15.3.1.
If Parties decide to use the default data (i.e., adopt the UNCCD modified Tier 1 method), steps 2 to 5 are unnecessary.
Step 2: Establish SOC reference values
This step is required if the UNCCD default data are not used (i.e., if a user specific modified tier 1 or a tier 2 approach is adopted). SOC values should be established for the reference year 2000. The default reference map used in the reporting process is the ISRIC SoilGrids 250m carbon stock map, which estimates SOC stocks for the top 30 cm of soil. However, given the high uncertainty in ISRIC datasets where in-situ soil data are sparse, countries are encouraged to use alternative datasets, including global or national SOC maps, to improve accuracy. Countries which participate in the Global Soil Organic Carbon Map (GSOCmap) initiative of the Food and Agriculture Organization of the United Nations (FAO) may choose to use the national SOC maps developed through that process. Table 14 lists the specification regarding data requirements for indicator SO1-3.
Item |
Specifications |
|
|---|---|---|
Default data |
National data |
|
Input data to generate the soil organic carbon (SOC) stock estimates |
International Soil Reference and Information Centre (ISRIC) SoilGrids250m dataset |
Ground observations and measurements or any other country-specific data to improve specification of any components |
Output data Gridded products of SOC stock estimates |
Gridded products of SOC stocks for the reference, baseline and reporting periods (2000, 2015, 2019, 2023) |
Gridded products of SOC stocks for the reference, baseline and reporting periods, with as close to annual data as possible |
Classification |
Continuous values of SOC content (tonnes) in the first 30 cm of soil. These should be classified into degraded, stable or improved according to the criteria in step 5 below |
Continuous values of SOC content (tonnes) in the first 30 cm of soil. These should be classified into degraded, stable or improved according to the criteria in step 5 below |
Spatial resolution |
250m |
The desired spatial resolution is 100m or finer. |
Quality |
Accuracy of ISRIC’s SoilGrids250m dataset between 30% and 70% |
Not less than the default data |
Metadata |
Metadata information is provided with default data in Trends.Earth. |
Minimum metadata content as per the mandatory fields are listed in Annex II. |
Step 3: Map land cover changes for SOC change estimation
This step is required if the UNCCD default data are not used (i.e.,if a user specific modified tier 1 or a tier 2 approach is adopted). Changes in SOC stocks over time are modeled using land cover conversion coefficients as proxies for land use, meaning that accurate identification of land cover transitions is essential for reliable results.
For the default dataset used in SOC stock change estimation, seven land cover classes, adapted from the IPCC land use categories, are used. The information on the changes in land cover over time is derived from the ESA-CCI default land cover dataset. Default conversion coefficients are available allowing for estimation of SOC changes. Parties may decide to use a custom land cover legend. In this case they should answer “Yes” to the opening question on the form and the subsequent tables will be dynamically updated with the custom land cover class names, replacing the default UNCCD seven classes. However, nationally determined conversion coefficients will be required.
When possible, countries may prefer to use national land cover maps. However, in order to apply the default SOC conversion coefficients, the land cover classifications must be aligned with the seven default categories. If a country has nationally determined SOC conversion coefficients for the national land cover legend, then it is acceptable to use additional land cover categories. Further refinements can be achieved through subnational stratification, where conversion coefficients vary based on subnational regions.
Step 4: Estimate changes in SOC stocks
Note
Related areas in the PRAIS 4 platform: table SO1-3.T2
This step is required if the UNCCD default data are not used (i.e.,if a user specific modified tier 1 or a tier 2 approach is adopted). Approaches to estimating SOC changes for a Tier 3 implementation are presented in step 5. As mentioned in the previous step, to estimate changes in soil organic carbon (SOC) stocks, conversion coefficients for land cover transitions are applied. The default conversion coefficients represent the proportional change in SOC stocks over a 20-year period following a land cover conversion. Figure 3 shows the default conversion coefficients. In this figure each cell represents a conversion coefficient, which indicates the proportional change in SOC stocks 20 years after a land cover change. The cells with a value of “1” (light yellow) indicate that there was no change in SOC stocks even if a land cover transition occurred. Cells with values lower than 1 (purple) indicate SOC loss after conversion. Cells with values higher than 1 (green) indicate SOC gains after conversion.
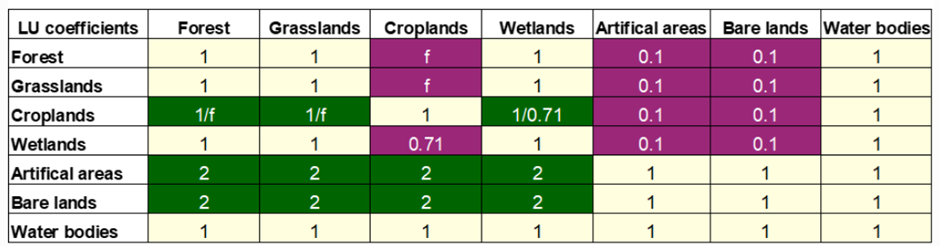
Figure 3. Default Land Use Conversion Coefficients for Soil Organic Carbon (SOC) Stock Changes. Source: Trends.Earth User Guide
Since the rate of SOC sequestration is influenced by environmental factors such as precipitation, evaporation, solar radiation, and temperature, it is not reasonable to apply the same conversion coefficient to vastly different climatic conditions. For instance, SOC loss due to land conversion in a cold and dry region will occur at a different rate than in a hot and humid region. To account for this regional variability, different sets of conversion coefficients are assigned based on climate zones:
Temperate Dry (f= 0.80)
Temperate Moist (f= 0.69)
Tropical Dry (f= 0.58)
Tropical Moist (f= 0.48)
Tropical Montane (f= 0.64)
It should be noted that since the reporting periods to the UNCCD are not a fixed 20-year period, it is necessary to estimate the annual rate of SOC change and adjust the conversion coefficients to be representative of the period over which the land cover change occurred. The approach to adjusting the conversion coefficients is fully described in the Addendum to the Good Practice Guidance.
If the default UNCCD data are used, then table SO1-3.T1 is automatically pre-filled with estimates of SOC (in tonnes per hectare) in the topsoil for each of the seven default land cover classes for the reference, baseline and reporting periods. If Parties use alternative national data they should provide these values and also provide basic metadata (see Annex II) for the datasets to be used in the Data Sources form that opens when “Edit Data Sources” is selected.
How to calculate the changes in SOC stock over the baseline period (2000 to 2015) and the reporting period (2016 to 2023), using the SOC reference values and the land use conversion coefficients is described in detail in the Good Practice Guidance for SDG Indicator 15.3.1 and the Addendum to the Good Practice Guidance, Section 3.
Step 5: Identify significant SOC changes
Note
Related areas in the PRAIS 4 platform: table SO1-3.T2
This step is required irrespective of the tier used. In the case of a modified Tier 1 or a Tier 2 approach, once the conversion coefficients and land cover transitions have been identified, the change of SOC stocks are calculated for each of the two periods, namely the baseline (2000 – 2015) and reporting period (2016 – 2023). The method to be applied is to assess both the direction of change and magnitude of the relative percentage change in SOC stocks, for both the baseline and reporting period. Then, for SOC stocks, the method of determining the status of change will be defined as:
Degraded: Reporting units with more than, for example, a 10 % average net reduction in SOC stocks between the beginning and end of the baseline period ( 2000 – 2015) and the beginning and end of the reporting period (2016 – 2023);
Stable: Reporting units with less than, for example, a 10 % average net reduction or net increase, or no change in SOC stocks between baseline and current observations;
Improved: Reporting units with more than, for example, a 10 % average net increase in SOC stocks between the beginning and end of the baseline period (2000 – 2015) and the beginning and end of the reporting period (2016 – 2023).
This 10% threshold is a suggested starting point but can be refined based on national data, expert knowledge, country-specific conditions and dataset-specific conditions. Trends.Earth offers countries the flexibility to explore different thresholds, and the resulting SOC degradation estimates, as the SOC stock change rasters contain the percentage change per pixel.
An alternative method is based on tests for statistical significance and compares the average SOC stock over the reporting period with the upper and lower bounds of the average SOC stock in the baseline period for the same unit of land. This method is presented in more detail in the Good Practice Guidance for SDG Indicator 15.3.1.
Both of these approaches presented only detect changes in SOC in areas where land cover changes occur. However, it is equally crucial to detect and model SOC changes in areas where land cover remains stable. Tier 3 methods, such as calibrated and validated ecosystem (process-based) modeling, offer a more comprehensive solution. These methods link models with country-specific spatial datasets, such as soil maps, land use, climate, and agricultural activity, providing a higher level of accuracy for estimating changes in SOC stocks. These approaches deliver more precise insights into SOC dynamics and therefore can improve the estimations of SDG indicator 15.3.1. Examples of countries which adopted aspects of a Tier 3 strategy during the 2022 reporting are presented in Section 3 of the Addendum to the Good Practice Guidance.
Once the national estimates of SOC degradation, improvement and stable SOC have been calculated for both the baseline and reporting period, the values in km2, as well as the percentage of total land area that this represents for each class are used to populate table SO1-3.T2.
Step 6: Verify the results
The default method draws on data generated from the assessment of land cover change associated with a set of default land conversion coefficients to determine SOC changes. As such, derived estimates provide limited information on how carbon stocks vary subnationally and have great uncertainty.
If countries have the ability to carry out sub-national assessments, they should indicate this in the reporting form by selecting “Yes” on the toggle button below Table SO1-3.T2. They may then upload a file describing this analysis in more detail.
Irrespective of the tier applied and the specific methods used, inputs from national experts are necessary to verify the results and detect and highlight situations where the confidence level of the obtained results might be low. This input would contribute to a qualitative assessment of the reliability of the estimates.
Step 7: Save form and make available for review
Parties are also encouraged to submit narratives on the methodology, data sources and data accuracy in cases where the default data and approach are not used. This may be done via the Comments fields associated with the tables SO1-3.T1 and SO1-3.T2 or in the General Comments field provided at the end of the reporting form.
Maps with default data representing SOC stocks and SOC degradation for the reference, baseline and the reporting periods are accessible via the PRAIS 4 platform. If Parties do not use the default values and choose to calculate the values based on alternative data they should upload maps to PRAIS:
SOC stock in the initial (reference) year of the baseline period (2000)
SOC stock in the final year of the baseline period (2015)
SOC stock in the final year of the first reporting period (2019)
SOC stock in the latest reporting year (ideally 2023)
Change in SOC stock in the baseline period (2000 to 2015)
Change in SOC stock in the reporting period (2016 to 2023)
SOC degradation in the baseline period (2000 to 2015)
SOC degradation in the reporting period (2016 to 2023)
Once the form has been completed and verified by the Parties, it should be marked as “In Review” and then saved. Once the UNCCD has completed its review and all comments have been resolved, the form can be marked as “Finalized” and then Saved.
1.3.4. Dependencies
Estimates of SOC stock per land cover class in SO1-3.T1 are dependent on the land cover legend reported under SO 1-1.T2 (if the Party has opted to report a national land cover legend) and the estimates of SOC degradation status in SO1-3.T2 are dependent on the total land area reported in table CP-1.T1.
1.3.5. Challenges
Data availability
It should be noted that the ISRIC SoilGrids250m is an ensemble dataset that collates data from a variety of sources over different years in and around the year 2000, however for the purposes of the calculations the SOC stocks are considered representative of the year 2000.
Detailed data on SOC stock are generally unavailable both at global and national levels. Current data are derived from a combination of contemporary and legacy data and are not fully integrated and consistent over time. Future data improvements must include standardization, accessibility, higher spatial resolution and improved uncertainty estimates;
SOC stock changes are primarily computed from land cover changes, while management and input factors are often not included because of lack of data. Usable methods to consistently collect and process relevant data to include management factors in the estimations of SOC should be considered for future reporting.
Unresolved issues
There is a challenge associated with hyper arid areas which lack topsoil. There is a need to update the methodology to take such special cases into full consideration and adjust the calculations accordingly;
Soil erosion and/or deposition may have significant effects on measured SOC stocks, but their effects on stock changes are included in the estimates of land-use and land-cover changes. Parties may consider including soil erosion and/or deposition as parameters for the implementation of the Tier 3 method.
1.3.6. Summary (main actions)
If Parties adopt their own Tier 1 approach or elements of a Tier 2 approach they should follow the main actions listed below. In case a Tier 3 process is implemented, they should follow the process as described in the Good Practice Guidance, but still ensure they follow steps 6 and 7 below.
Select tier for SOC assessment based on data availability: Parties may opt for one of the three proposed Tier methods to report national data to UNCCD, depending on their technical capacity to estimate SOC stock changes and on the availability of national data;
Establish SOC reference values: Estimate the average SOC stock in the topsoil (0–30 cm) for the reference year 2000. The default reference map used in the reporting process is the ISRIC SoilGrids 250m carbon stock map. However, countries are encouraged to use alternative datasets, if available and deemed more accurate.
Map land cover changes for SOC change estimation: For the default dataset used in SOC stock change estimation, seven land cover classes, adapted from the IPCC land use categories, are used. Default land cover conversion coefficients are available allowing for estimation of SOC changes. When possible, countries may prefer to use national land cover maps. If an alternative land cover legend other than the seven class UNCCD default one is used, a nationally determined set of land cover conversion coefficients will be required.
Estimate change in SOC stocks: To estimate changes in SOC stocks, conversion coefficients for land cover transitions are applied. The default conversion coefficients represent the proportional change in SOC stocks over a specific period following a land cover conversion. Parties may use nationally determined conversion coefficients if available.
Identify significant SOC changes: For the major land cover transitions, calculate the net change in SOC. Changes across the transitions are accumulated in order to indicate whether there has been SOC degradation, improvement or no significant change (stable) based on the estimated SOC stock changes with respect to the reference year. A statistical approach based on the significance of change or a relative approach based on the percentage change can be adopted. By default, land units with relative declines of >10 per cent in SOC stock between the start and end years of the baseline (2000-2015) and reporting period (2016-2023) are considered degraded;
Verify the results: It is recommended that SOC changes and related land degradation estimates are verified by the relevant national authorities to assess the accuracy of the results and identify any false positive and negative situations which can be reported on in the SO 1-4 forms (SDG indicator 15.3.1);
Save form and make available for review: Once verified by the Parties, the data and supporting narrative should be marked as “In Review” and saved thereby making it available for review by the UNCCD.
1.3.7. Additional Resources
UNCCD, 2024. The Land Story: Country experiences with reporting on land degradation and drought, Chapter: Trends in Carbon Stocks: (https://www.unccd.int/resources/publications/land-story-country-experiences-reporting-land-degradation-and-drought)
IPCC, 2006. Eggleston, S., Buendia L., Miwa K., Ngara T., and Tanabe K. (Eds). 2006 IPCC Guidelines for National Greenhouse Gas Inventories. Intergovernmental Panel on Climate Change (IPCC)/Institute for Global Environmental Strategies (IGES), Hayama, Japan.
IPCC, 2013. Hiraishi, T., Krug, T., Tanabe, K., Srivastava, N., Baasansuren, J., Fukuda, M. and Troxler, T.G. (Eds). 2013 Supplement to the 2006 IPCC Guidelines for National Greenhouse Gas Inventories: Wetlands. Intergovernmental Panel on Climate Change (IPCC), Switzerland.
IPCC. 2019. Refinement to the 2006 IPCC Guidelines for National Greenhouse Gas Inventories. In: Buendia, E., Tanabe, K., Kranjc, A., Baasansuren, J., Fukuda, M., Ngarize, S., Osako, A., Pyrozhenko, Y., Shermanau, P., Federici, S. (eds). Intergovernmental Panel on Climate Change, Geneva, Switzerland.
‘Trends.Earth User Guide’ (https://docs.trends.earth/en/latest/index.html).
1.4. SO 1-4 – Proportion of land that is degraded over total land area (Sustainable Development Goal indicator 15.3.1)
1.4.1. Introduction
Land degradation is defined as ‘the reduction or loss of the biological or economic productivity and complexity of rainfed cropland, irrigated cropland, or range, pasture, forest and woodlands resulting from a combination of pressures, including land use and management practices[7]’.
Using the three indicators SO 1-1, SO 1-2 and SO 1-3 (hereinafter referred to as sub-indicators), UNCCD reporting will estimate the proportion of land that is degraded over total land area, which is also SDG indicator 15.3.1 and the only indicator used to track progress towards target 15.3: ‘By 2030, combat desertification, restore degraded land and soil, including land affected by desertification, drought and floods, and strive to achieve a land-degradation neutral world’. In line with decision 15/COP.13, the estimates of SDG indicator 15.3.1 contained in national reports will be submitted by the secretariat, in its capacity as the custodian agency for this indicator, to the United Nations Statistics Division for publication in the SDG Report and Global Database.
Knowing the extent and location of degraded land is instrumental to achieving land degradation neutrality (LDN) at national level and supporting Parties in setting national voluntary targets.
SDG Indicator 15.3.1 is reported as a percentage value, representing the proportion of degraded land in relation to a country’s total land area—defined as the entire surface area excluding inland waters such as major rivers and lakes. The area in km2 is reported as ancillary information, for transparency and as it allows regional and global aggregates to be calculated.
UNCCD facilitates reporting on SDG indicator 15.3.1 by providing pre-filled data in the PRAIS 4 platform with values derived from default datasets.
Parties have the option to identify areas of ‘false negative’ or of ‘false positive’ errors in the identification of degradation. The reporting form in the PRAIS 4 platform allows for a full description of these sites, including their geographical locations, the delineation of their extents and the processes driving the false negative/false positive interpretations.
Parties are also encouraged to identify and describe ‘hotspots’ and ‘brightspots’ as areas experiencing the most evident and dramatic changes in (i) land degradation; and (ii) improvement, respectively.
1.4.2. Prerequisites for reporting
An in-depth reading of chapter 2 of the Good Practice Guidance for SDG Indicator 15.3.1;
Familiarity with the Addendum to Good Practice Guidance for SDG Indicator 15.3.1: Proportion of land that is degraded over total land area (version 2).
A pool of national experts officially nominated by the national authorities to verify the reliability of the land degradation estimates. Key institutions might include a country’s national statistical office, ministry of environment, ministry of agriculture, ministry of water resources, remote-sensing centre, as well as universities and research centers. Consultation with the national statistics office is particularly important given its responsibility to review and validate national estimates of SDG indicator 15.3.1 prior to the final submission to the United Nations Statistics Division for inclusion in the Sustainable Development Goals Report and the Global SDG Indicators Database.
1.4.3. Reporting process and step-by-step procedure
The step-by-step procedure for reporting is described in the following. If Parties decide to use the default data, step 1 is unnecessary.
Step 1. Calculate Sustainable Development Goal indicator 15.3.1
Note
Related areas in the PRAIS 4 platform: table SO1-4.T1 and SO1-4.T2
In order to calculate SDG indicator 15.3.1, the results of the degradation analysis for each of the sub-indicators are integrated using a One-Out All-Out (1OAO) method in which a significant reduction or negative change in any one of the three sub-indicators is considered to represent land degradation. The result is a binary assessment where a land unit (pixel) is either degraded or not degraded (stable or improved).
The analysis of change in degradation involves first establishing a baseline of land degradation. The baseline sets the benchmark extent of land degradation against which progress towards achieving SDG target 15.3 and LDN is assessed in the reporting period.
In practical terms, for the purposes of calculating SDG indicator 15.3.1, tracking change in the extent of degraded land is a four-stage process:
Baseline assessment: In the Baseline Assessment, the results of the degradation analysis for each of the sub-indicators for the baseline period (2000-2015) are combined using the 1OAO method. The resulting baseline map shows areas that degraded, improved or remained stable during the baseline period, and enables the calculation of the baseline extent of degradation as a benchmark for measuring progress towards achieving SDG target 15.3.
Period assessment: Similarly, the Period Assessment is the result of the evaluation of land condition for a specific reporting period, based on the combination of the three sub-indicators by applying the 1OAO method.
Status Assessment: The “Status”, or final condition of the land at the end of each reporting period, is determined by combining the results of the current period assessment with the baseline assessment. This can be done using The “Status Matrix” (see figure 4) which shows the different possible combinations of the changes in land condition between the baseline and the reporting periods. This comparison is essential to account for areas identified as degraded in the baseline that have since remained unchanged in land condition. For example, if an area was classified as degraded during the baseline period but was stable afterwards, the land’s condition is still degraded as there has been no improvement since the baseline. The resulting Status map enables the estimation of SDG Indicator 15.3.1 by providing a spatially explicit view of areas that are either stable, improved, or degraded, considering also their initial condition.
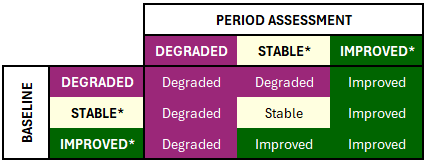
Figure 4. The “Status Matrix” is a 3 x 3 matrix to assess Status by comparing the reporting period assessment (columns) and the baseline (rows). The categories Stable and Improved correspond to Not Degraded areas.
* Not Degraded areas
Change Assessment: The change in extent of degradation between the baseline and the reporting period is calculated as the difference between the total area of degraded land in and the most recent reporting period, and the baseline. It can be expressed as either the change in terms of absolute area or as the change in terms of the proportion of degraded area over the total land area (percentage).
The results of the Status Assessment can be reported in table SO1-4.T1.
Parties may also provide information in the comments field after Table SO1-4.T1 on assumptions and procedures adopted in relation to completion of the status matrix.
The total area of degraded land for the baseline and the two reporting periods (up to 2019 and 2023 respectively) should be reported in table SO1-4.T2. While the 2026 UNCCD reporting process focuses on the period 2016–2023, it is necessary to recalculate the baseline and 2019 estimates submitted in the previous reporting round. This ensures consistency across the time series, enhances comparability over time, and enables a complete submission to the United Nations Statistics Division for inclusion in the SDG database.
The area change and the proportion of degraded land relative to the total land area (SDG indicator 15.3.1) will be automatically calculated in table SO1-4.T2 based on the total land area estimates contained in table CP-1.T1.
In addition, Parties should report additional information on the indicators used, the method used, for example if different from the 1OAO approach, as well as indicate the level of confidence of the estimates (high, medium or low). This can be done by using the tick boxes and toggle buttons as well as the comments field after table SO1-4.T2.
Step 2. Identify false positives and false negatives
Note
Related areas in the PRAIS 4 platform: table SO1-4.T3
What are false positives?
An example is a woody weed invasion of a grassland, which may raise the apparent plant productivity even though the outcome in terms of the change in land condition would normally be negative. This is a false ‘positive’ or apparent improvement in land condition. In the 1OAO process, the area undergoing woody encroachment would be incorrectly indicated as not degraded even though the change in land condition is considered to be sufficiently negative to qualify as degraded in the context of SDG indicator 15.3.1. A similar outcome arises in lands invaded by alien plant species.
What are false negatives?
An example is the inverse of the above problem where woody weeds (or invasive plant species) are removed as part of a remediation process, causing a reduction in apparent productivity. This would normally lead to an indication of degradation even though the intention is to restore degraded lands. In the 1OAO process, the remediated area would be incorrectly labelled as being degraded.
Therefore, in reporting Parties have the option to identify both of these types of areas:
‘False positive’ degradation, where the 1OAO process has incorrectly indicated that an area is not degraded even though the change in land condition is considered sufficiently negative to qualify as degraded in the context of SDG indicator 15.3.1; and
‘False negative’ degradation, in which the outcome of the 1OAO process has incorrectly resulted in an area being identified as degraded.
In areas where a false positive or false negative degradation outcome is identified, Parties can use the PRAIS 4 spatial data viewer to provide further spatial detail in addition to the reporting fields in table SO1-4.T3. Spatial delineation of false positive and negative areas should only be carried out where countries are confident that they know the timing, location and extent of these counterintuitive processes. However, in reporting spatially, Parties can then opt to recalculate the outcomes of the 1OAO process through Trends.Earth and import the recalculated results. Without spatial delineation of the false positive and/or negative area, there will be no material impact on the reporting data.
Reporting on false positive and negative extents using the PRAIS 4 platform requires table SO1-4.T3 to be filled in. The PRAIS 4 spatial data viewer supports the filling in of this table with spatial information (in vector format). However, it remains an optional element and the table can still be filled in without the provision of spatial data. Information about the location of the sites, the areal extent of the site (auto-filled by the PRAIS 4 spatial data viewer, if used), the processes behind the false positive/false negative outcome and the basis for their judgement should be reported in addition to the period when the false negative or false positive process started. For those Parties using the PRAIS 4 spatial data viewer to delineate the extents, an informative graphic can be used to interpret the percentage of the total area delineated that is degraded or improved per sub-indicator. This graphic chart should be used as a guide to understand what sub-indicator is driving the false positive or negative process being reported within the polygon extent provided.
For example, during the 2022 reporting cycle, Türkiye identified false positive cases where areas had been originally coded as improved. These were then recoded to degraded as they had in fact been converted to artificial surfaces. Some false negative areas were also highlighted as they had been marked as degraded, when in reality the land was improved due to afforestation. Türkiye’s land degradation analysis was based on a set of nationally generated data sets, and the analysis of false positives and negatives was carried out in a workshop where participants were able to use a decision support system to aid the analysis. Ultimately, discussions and interpretation made among the experts led to the results reported. Further details on this as well as other examples of the identification of false positives/negatives are described in The Land Story (UNCCD, 2024).
Step 3. Assess hotspots and brightspots
Note
Related areas in the PRAIS 4 platform: tables SO1-4.T4 and SO1-4.T5
UNCCD encourages Parties to signal areas experiencing the most evident and dramatic change. These are defined as:
Hotspots: areas that are highly vulnerable to degradation in the absence of urgent remediation activities;
Brightspots: areas that do not exhibit any signs of degradation, or which have been remediated from a degraded state by implementing appropriate remediation activities or through land planning processes to prevent degradation.
In previous reporting countries have taken different approaches to identifying land degradation hotspots. These approaches include:
Context-specific approaches: Each country tailors its hotspot identification method based on national priorities and data availability, often guided through participatory workshops with local experts.
Use of existing data and tools: Countries use pre-identified polygons (e.g., from forest fire, mining, or overgrazing zones) and national degradation maps integrated into their Land Degradation Neutrality Decision Support System (LDN DSS).
Convergence of evidence: Some countries apply a multicriteria analysis in the LDN DSS, combining various indicators (e.g., erosion, salinization, biomass loss, NPP decline) to identify priority areas through evidence convergence.
Brightspots are generally associated with areas where countries have implemented sustainable land management (SLM) practices, and actual improvements on the ground have been noted.
Knowledge about location and type of hotspots/brightspots may facilitate the development of plans of action to redress degradation, including through the conservation, rehabilitation, restoration and sustainable management of land resources.
Hotspots and brightspots are reported in tables SO1-4.T4 and SO1-4.T5 of the PRAIS 4 platform, respectively. Parties are invited to enter relevant information such as location, area, the adopted assessment process, the drivers/processes determining the status of the land, and remediation actions taken and planned. These are spatial tables and therefore should be completed with the support of the geographic information system tools available in the PRAIS 4 spatial data viewer. This is an additional and optional element, but such location-based information can strengthen spatial approaches to sustainable land management and help integrate responses to land degradation at the landscape scale. In addition, UNCCD can use these spatial data to create improved information products to demonstrate the impact of the Convention.
Parties are invited to provide descriptive information or stories on one or more of the hotspots/brightspots reported via the text fields provided. This information helps to contextualise the spatial information provided.
Step 4. Verify the results
Verification should take place during the derivation of each sub-indicator. In addition, the implementation of the 1OAO or alternative methods to assessing land degradation should be verified. Furthermore, the Parties should assess and justify the level of confidence in the assessment of the proportion of degraded land. Any declared false positives/negatives, hotspots and brightspots should also be carefully verified.
Step 5. Save form and make available for review
Special or anomalous situations and noticeable issues related to the data interpretation that may affect the reliability of the reported values should be described in the narrative. A ‘General Comments’ field is provided at the end of the reporting form of the PRAIS 4 platform for this purpose.
Information on land degradation should be reported in km2 for the entire country.
Default maps or maps generated in Trends.Earth using national data representing land degradation for the baseline/reporting period are made available in the PRAIS 4 platform. More specifically, the following maps will be available online:
Proportion of land that is degraded over total land area (SDG indicator 15.3.1) in the baseline period
Proportion of land that is degraded over total land area (SDG indicator 15.3.1) in the reporting period
Proportion of land that is degraded over total land area (SDG indicator 15.3.1) in the reporting period after recalculation for false positives and negatives in Trends.Earth (if applicable)
Land Condition (2023) – see GPG on SDG Indicator 15.3.1 Addendum section 2.1 for further details
Degradation hotspots (for countries that provide spatial data in the PRAIS 4 platform)
Improvement brightspots (for countries that provide spatial data in the PRAIS 4 platform).
Once the form has been completed and verified by the Parties, it should be marked as “In Review” and then saved. Once the UNCCD has completed its review and all comments have been resolved, the form can be marked as “Finalized” and then Saved.
1.4.4. Dependencies
SDG indicator 15.3.1 relies on the total land area reported in table CP-1.T1. Modifying that number will therefore alter the indicator’s value.
The ‘Area’ fields of the spatial tables SO1-4.T3, SO1-4.T4 and SO1-4.T5 have a dependency on spatial data created by countries using the PRAIS 4 spatial data viewer. However, they can also be filled in manually without providing supporting spatial data.
1.4.5. Summary (main actions)
Key actions for reporting on the SDG indicator 15.3.1 are as follows:
Calculate the proportion of land that is degraded over total land area (SDG indicator 15.3.1): Using the 1OAO approach to combine the three sub-indicators, calculate the extent of degradation in the baseline period and in the two reporting periods (2019 and 2023 respectively). The extent of degradation in the reporting periods is calculated by summing (i) areas of land where changes in the sub-indicators are considered to indicate new degradation; and (ii) areas of land that have persisted in a degraded state since the baseline period (i.e. have not improved to a non-degraded state).
Identify false positive and false negative processes and provide the relevant justification to support their assessment. Where countries are confident in reporting the location and extent of these processes and in recalculating the 1OAO process for SDG indicator 15.3.1 with the identified areas accounted for, they should use the PRAIS 4 spatial data viewer to do so (table SO1-4.T3).
Assess hotspots of land degradation and brightspots of land improvement, indicating their locations, extents, and actions taken and/or planned to manage them and ensure the sustainable development of the areas (tables SO1-4.T4 and SO1-4.T5). Countries are encouraged to report spatially on hotspots and brightspots using the PRAIS 4 spatial data viewer.
Verify the results: It is recommended that the data, methods and analyses that led to the calculation of SDG indicator 15.3.1 are thoroughly verified by the concerned national authorities to assess the accuracy of the results and confirm any false positive and negative situations, as well as hotspots and brightspots reported;
Save form and make available for review: Once verified by the Parties, the data and supporting narrative should be marked as “In Review” and saved thereby making it available for review by the UNCCD.
1.4.6. Additional Resources
UNCCD; 2024, The Land Story: Country experiences with reporting on land degradation and drought, Chapter: Land Degradation, UNCCD: (https://www.unccd.int/resources/publications/land-story-country-experiences-reporting-land-degradation-and-drought)
Scientific Conceptual Framework for Land Degradation Neutrality ( https://www.unccd.int/resources/reports/scientific-conceptual-framework-land-degradation-neutrality-report-science-policy)